

Here is an expanded view of Day 287, as referenced on the Dynamics Explorer Page.
Click on images for links to jpegs.
 |
Retarding Ion Mass Spectrometer, Hydrogen Channel, Radial Detector, RPA analysis (top), Spin Analysis (bottom panel). The aperture bias was cycled with the pattern: 0V, -2V, 0V, -4V, 0V, -8V, repeat. There is a faint trace from the sun pulse at the 1-2 count per accumulation level visible in the spin-time panel (bottom). |
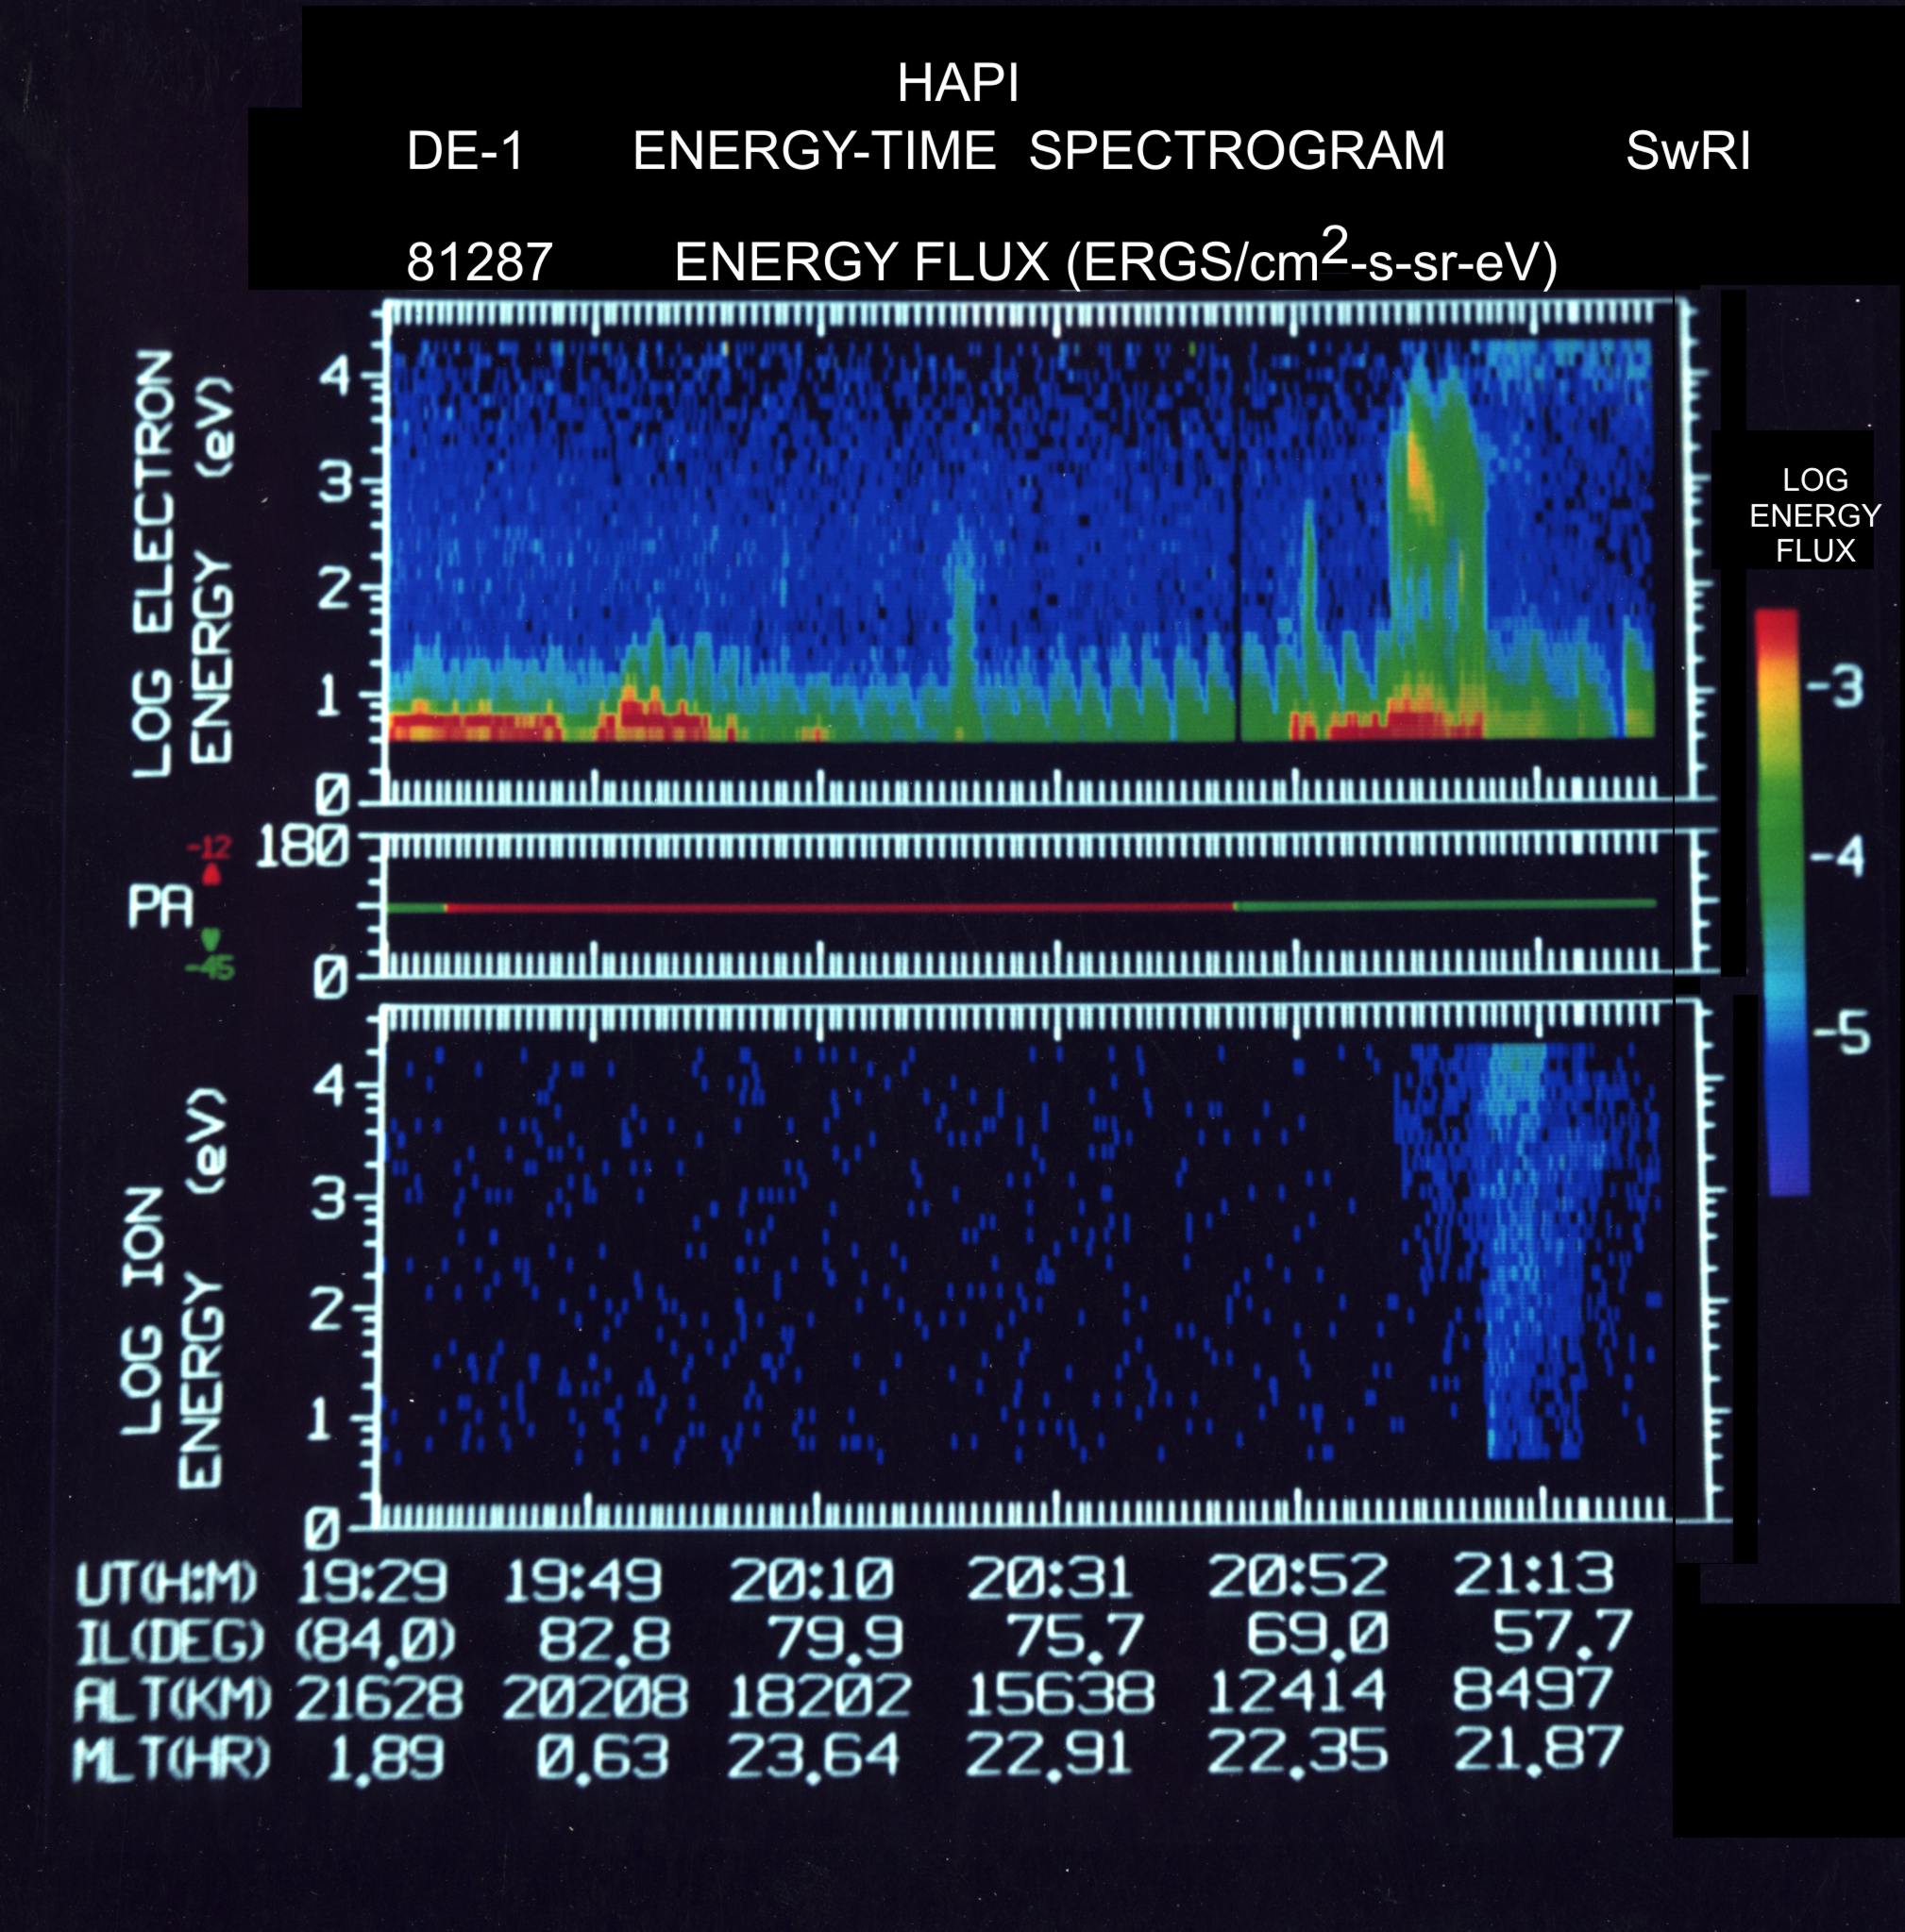 |
High Altitude Particle Instrument (HAPI) from Southwest Research Institute (SwRI). Electrons (top panel), ions (bottom Panel). 5eV to 30 KeV. Not much to see except a bunch of low energy electrons - mostly s/c generated photoelectrons, in this case. |
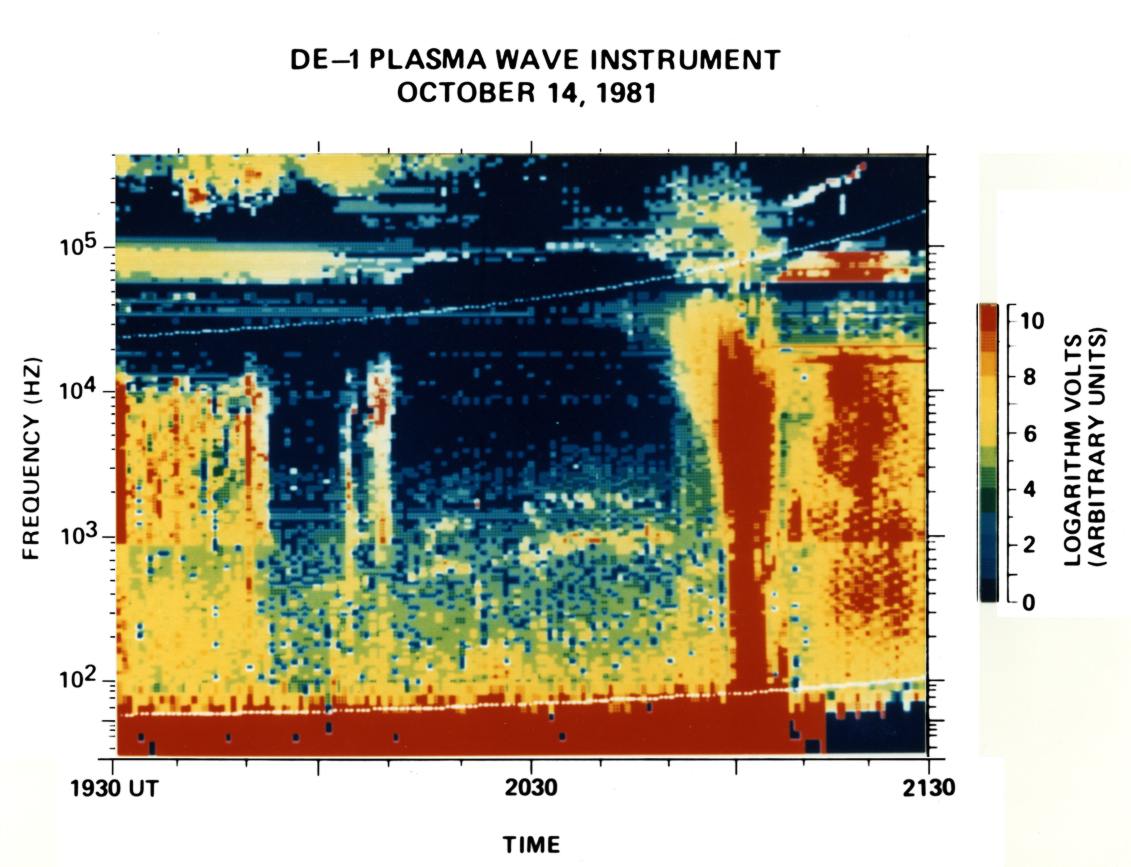 |
Plasma Wave Data (University of Iowa). You can see the UHR from 2000-2040 or so, when the density is about 100 cm-3 (100 KHz). |
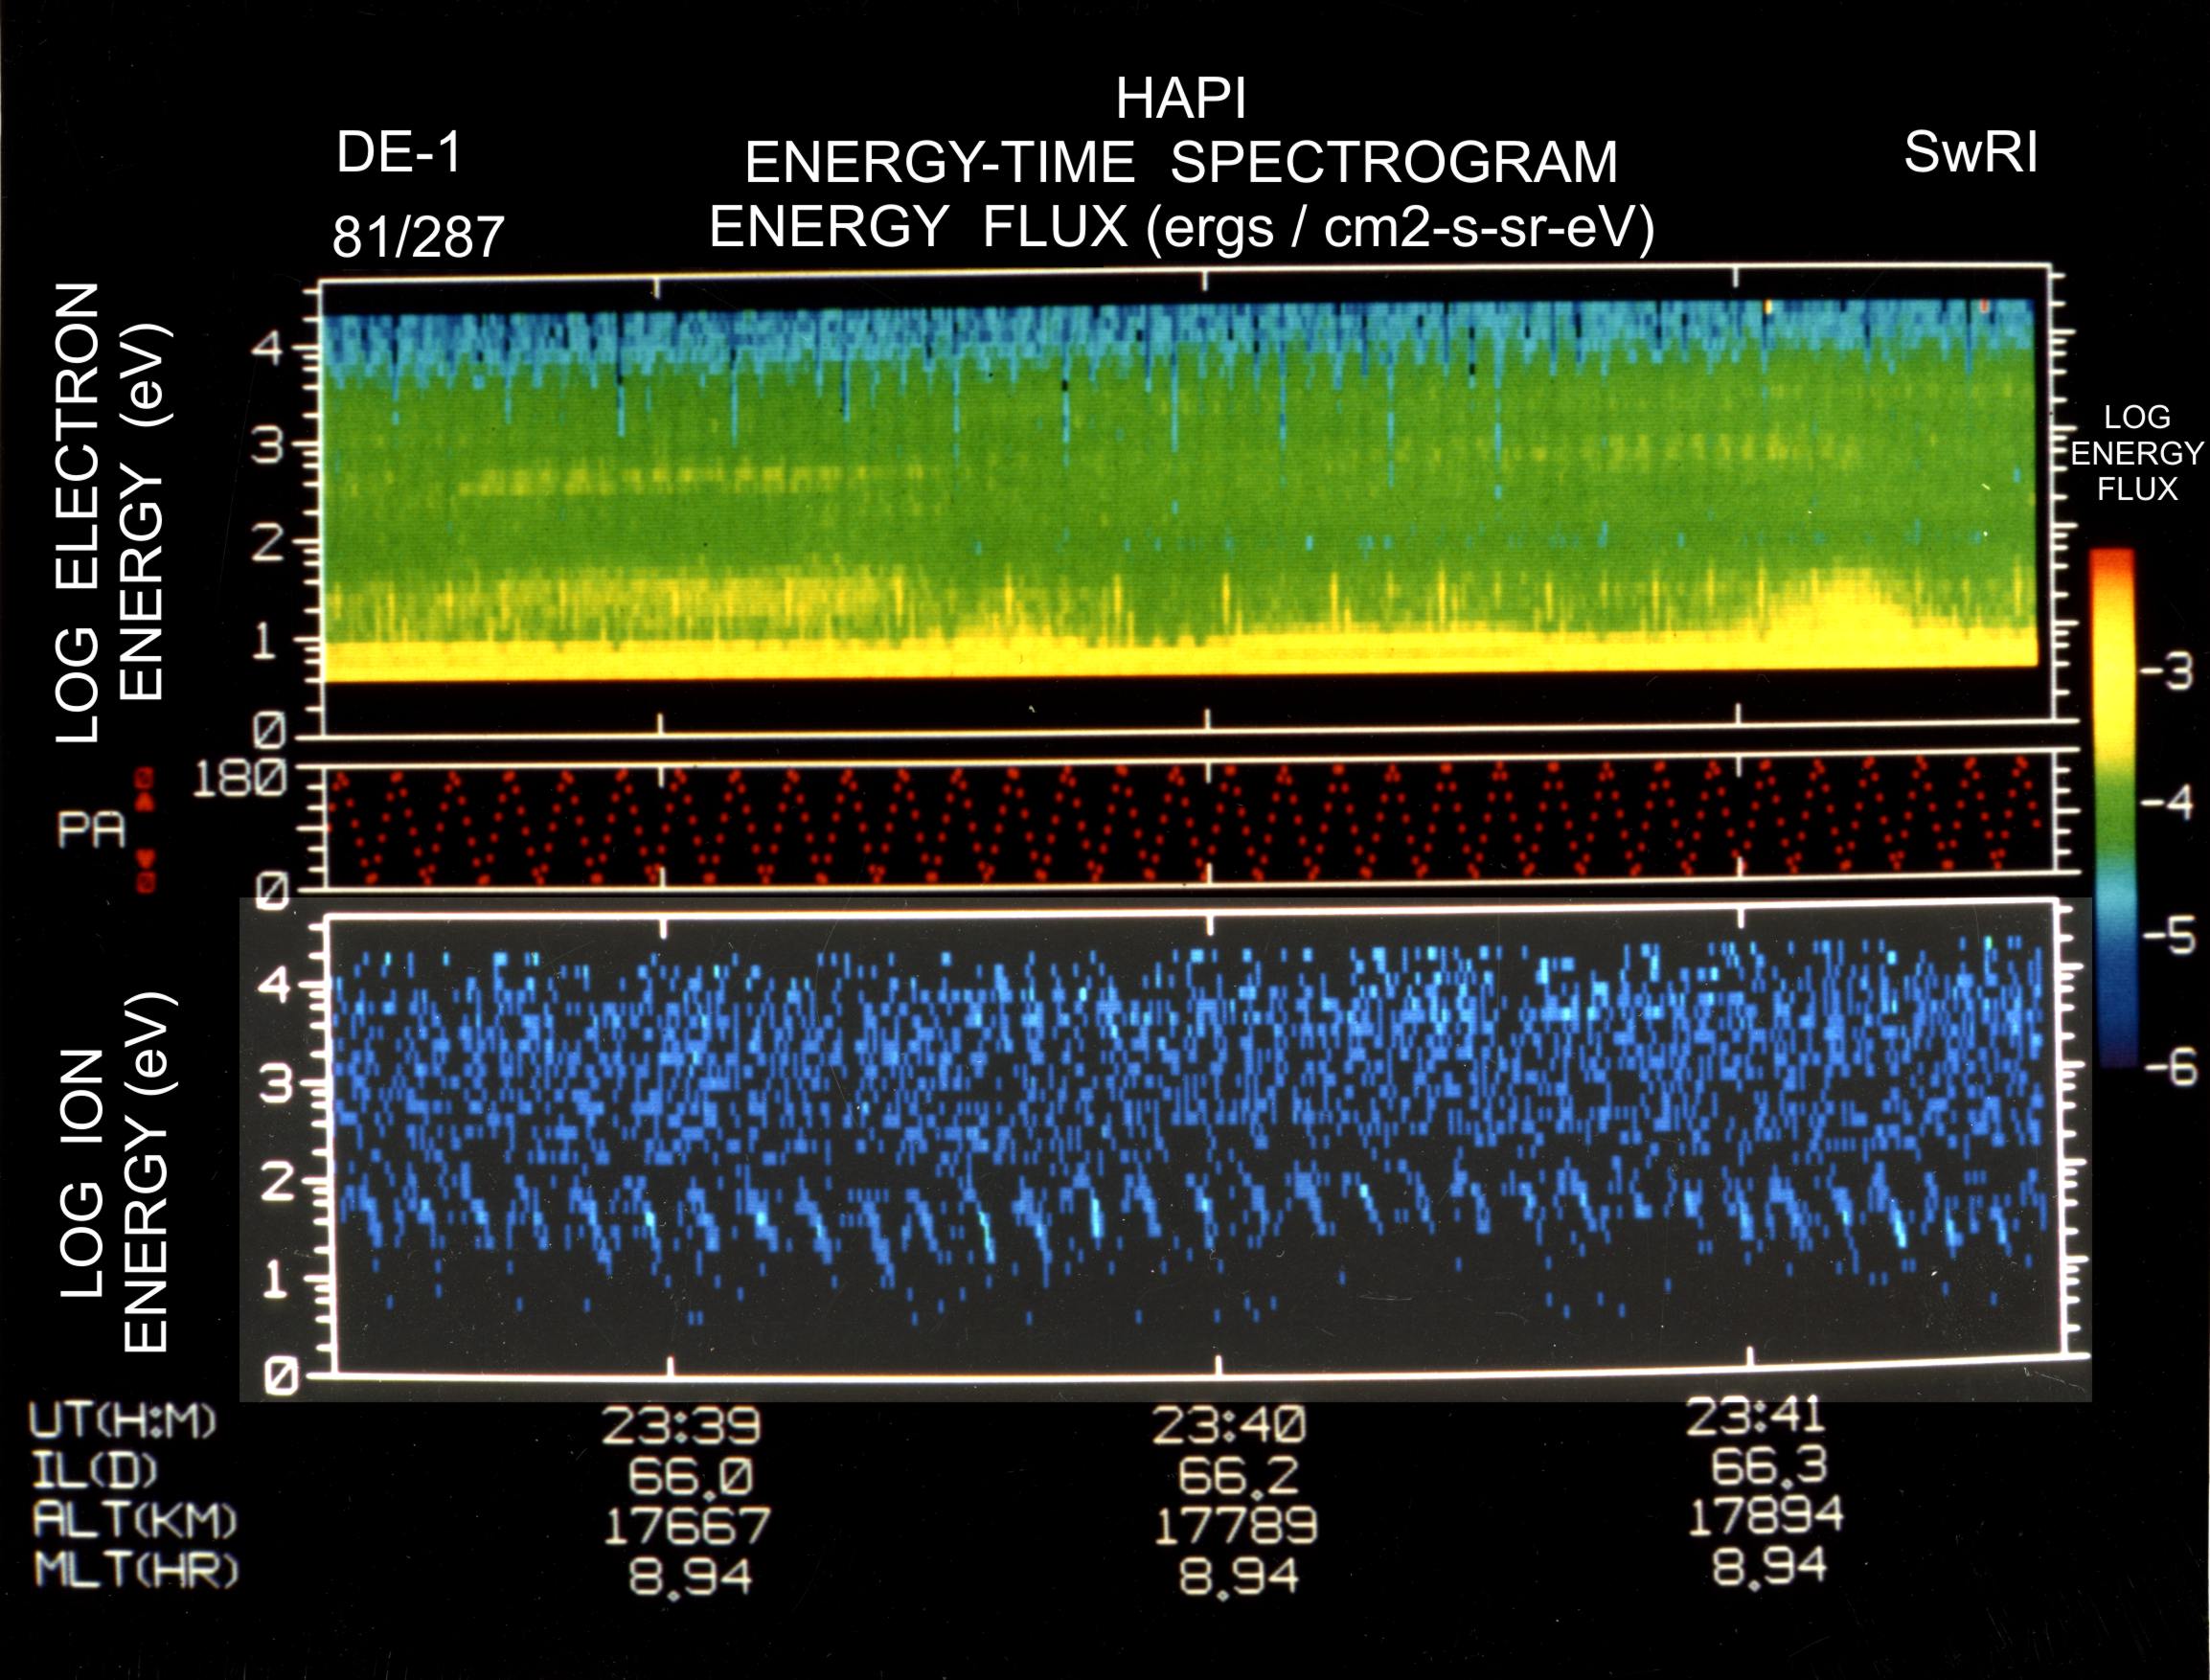
Next, From the aperture bias paper (Olsen et al). This is three hours later than the inbound pass shown above. Note on the HAPI figure. Everybody knows that the ion fluxes are a factor of 43 or so down from the electron flux, but I could never convince SwRI to replot the data with independent flux scales. So, their ion fluxes all plot as blue. When I scanned the print, I pushed the dynamic range so the dark blue trace would show - the triangular traces are the pitch angle modulated HAPI response to ions above the RIMS energy range.
 |
| RIMS, Hydrogen |
 |
| HAPI, ions and electrons |
Eventually we got all the data from this orbit. Here are all 3 of the detectors, hydrogen (low channel) and helium (upper channel). In each image, there are 4 panels, ordered from 0V bias to -8V bias.
| Hydrogen | Helium | |
| Spin-phase vs. time, radial detector | 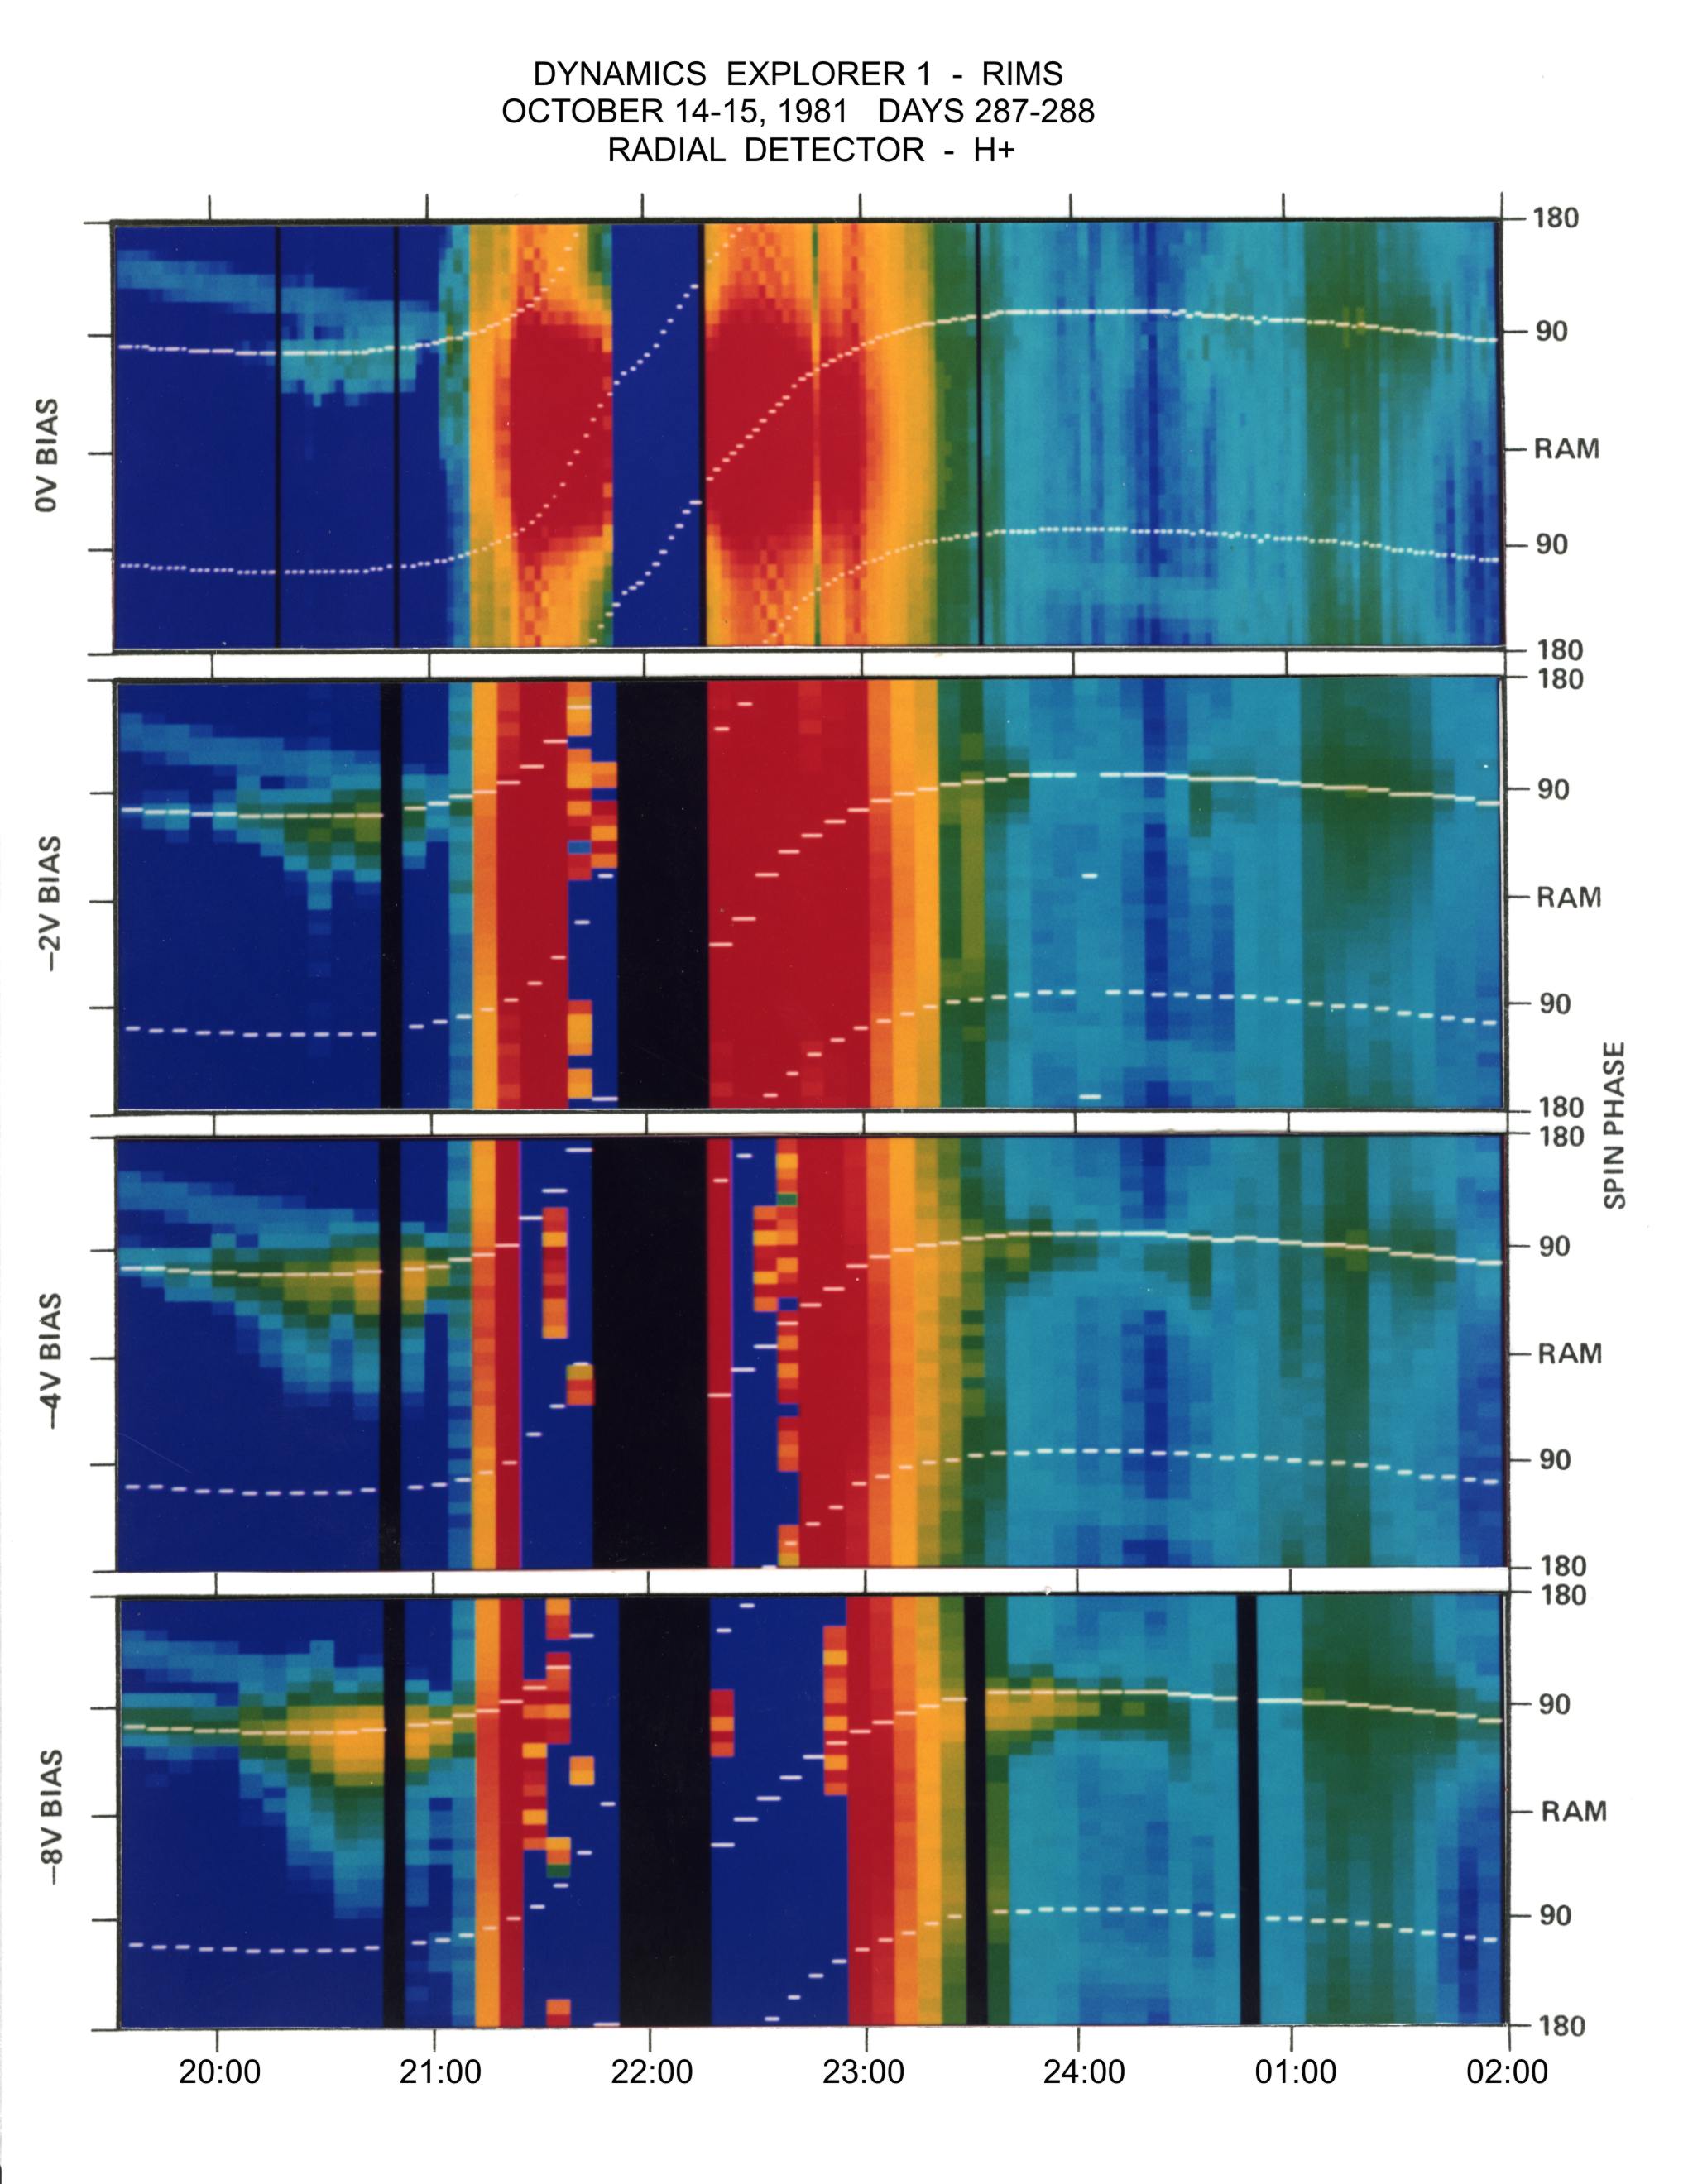 | 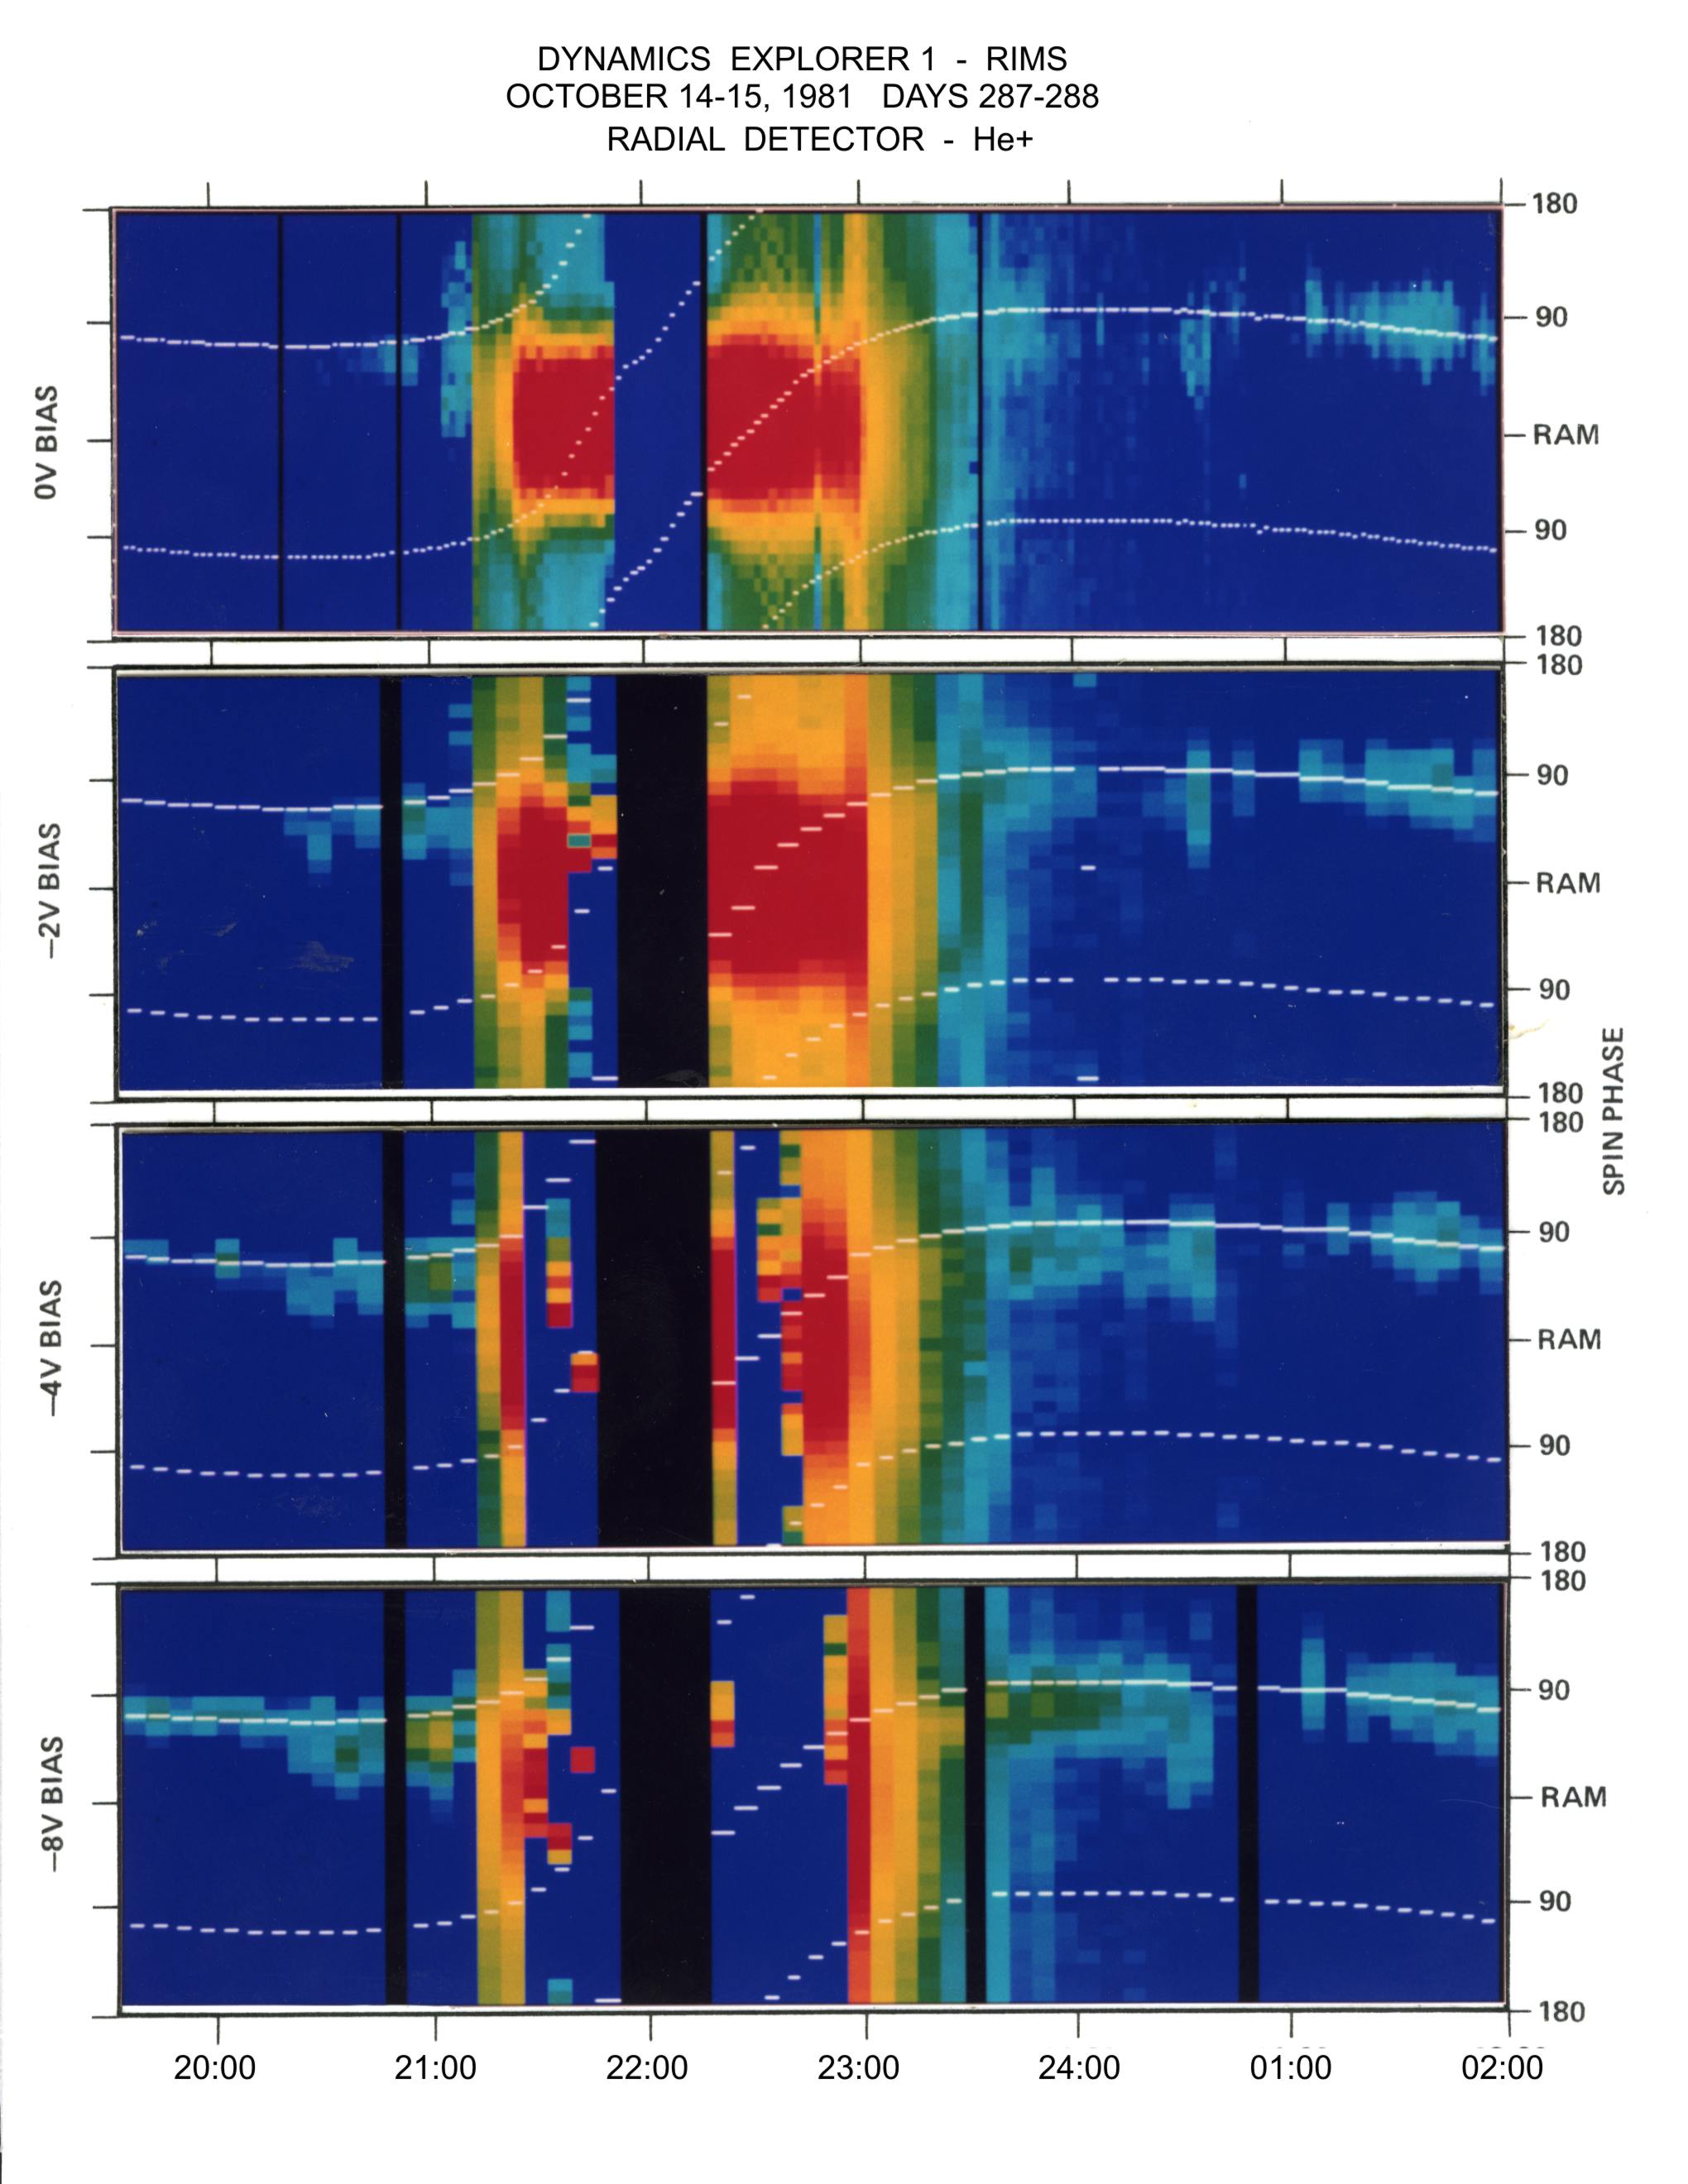 |
| RPA vs. time, radial detector, spin averaged | 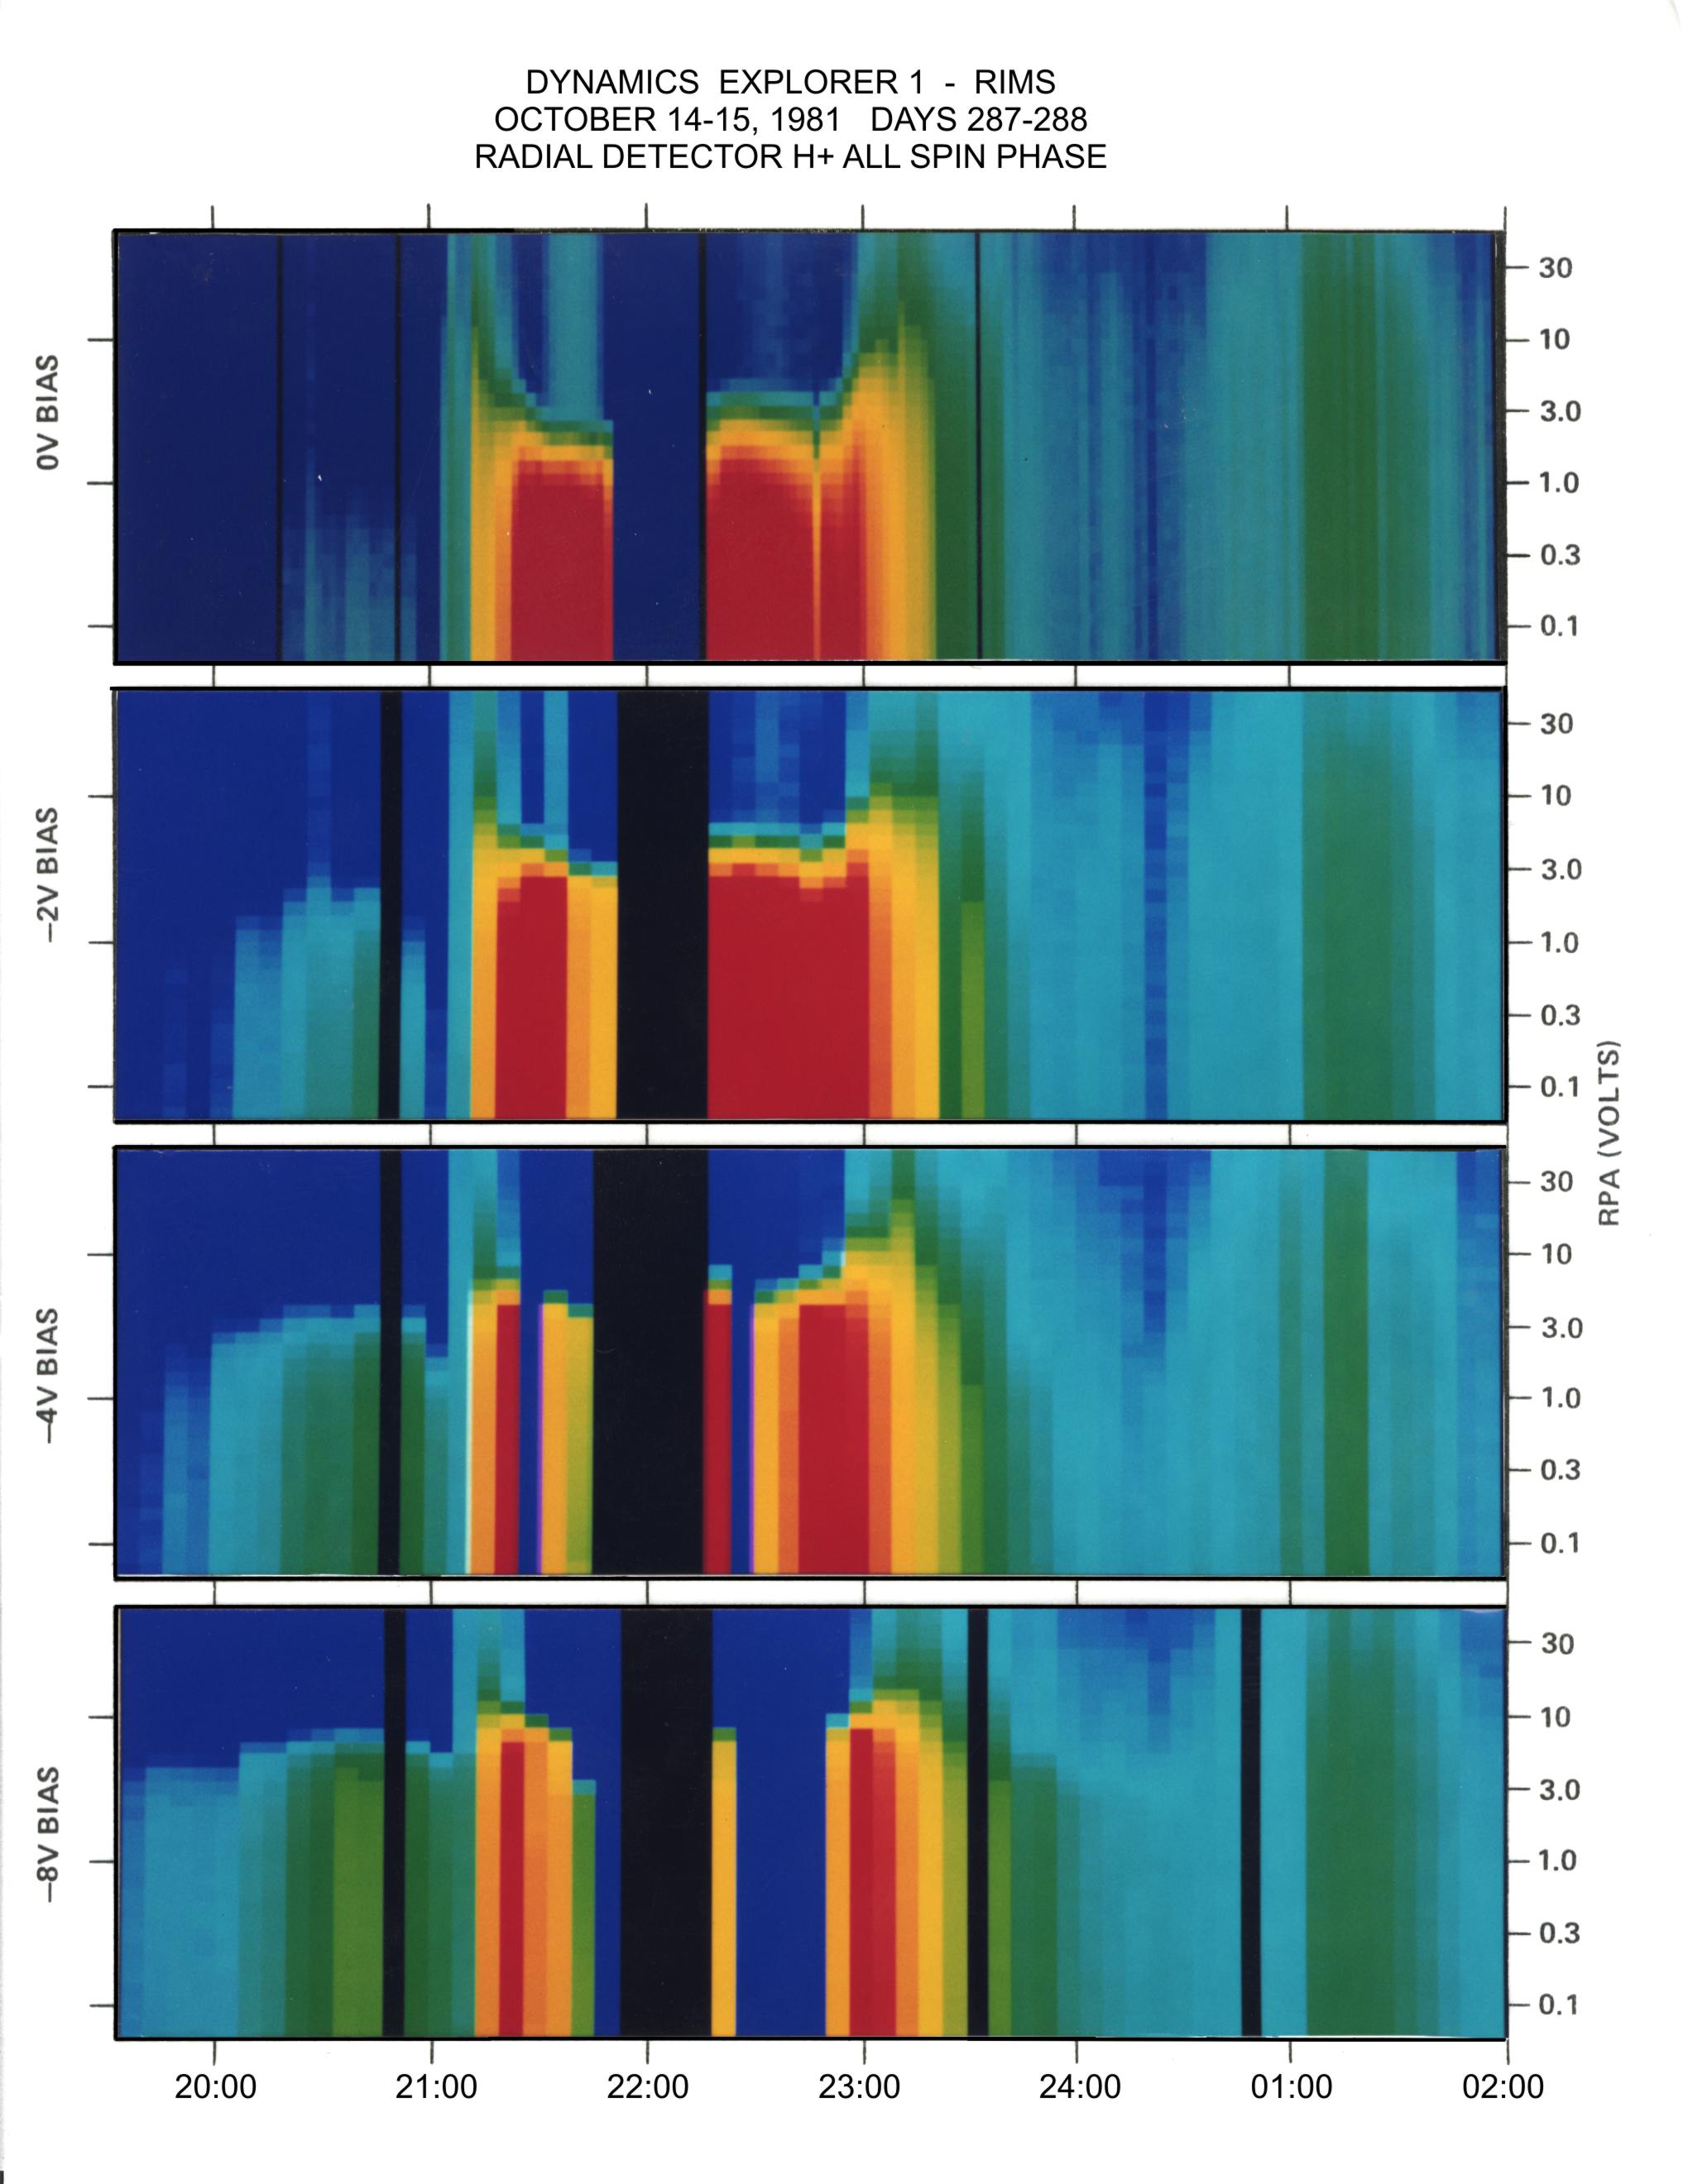 | 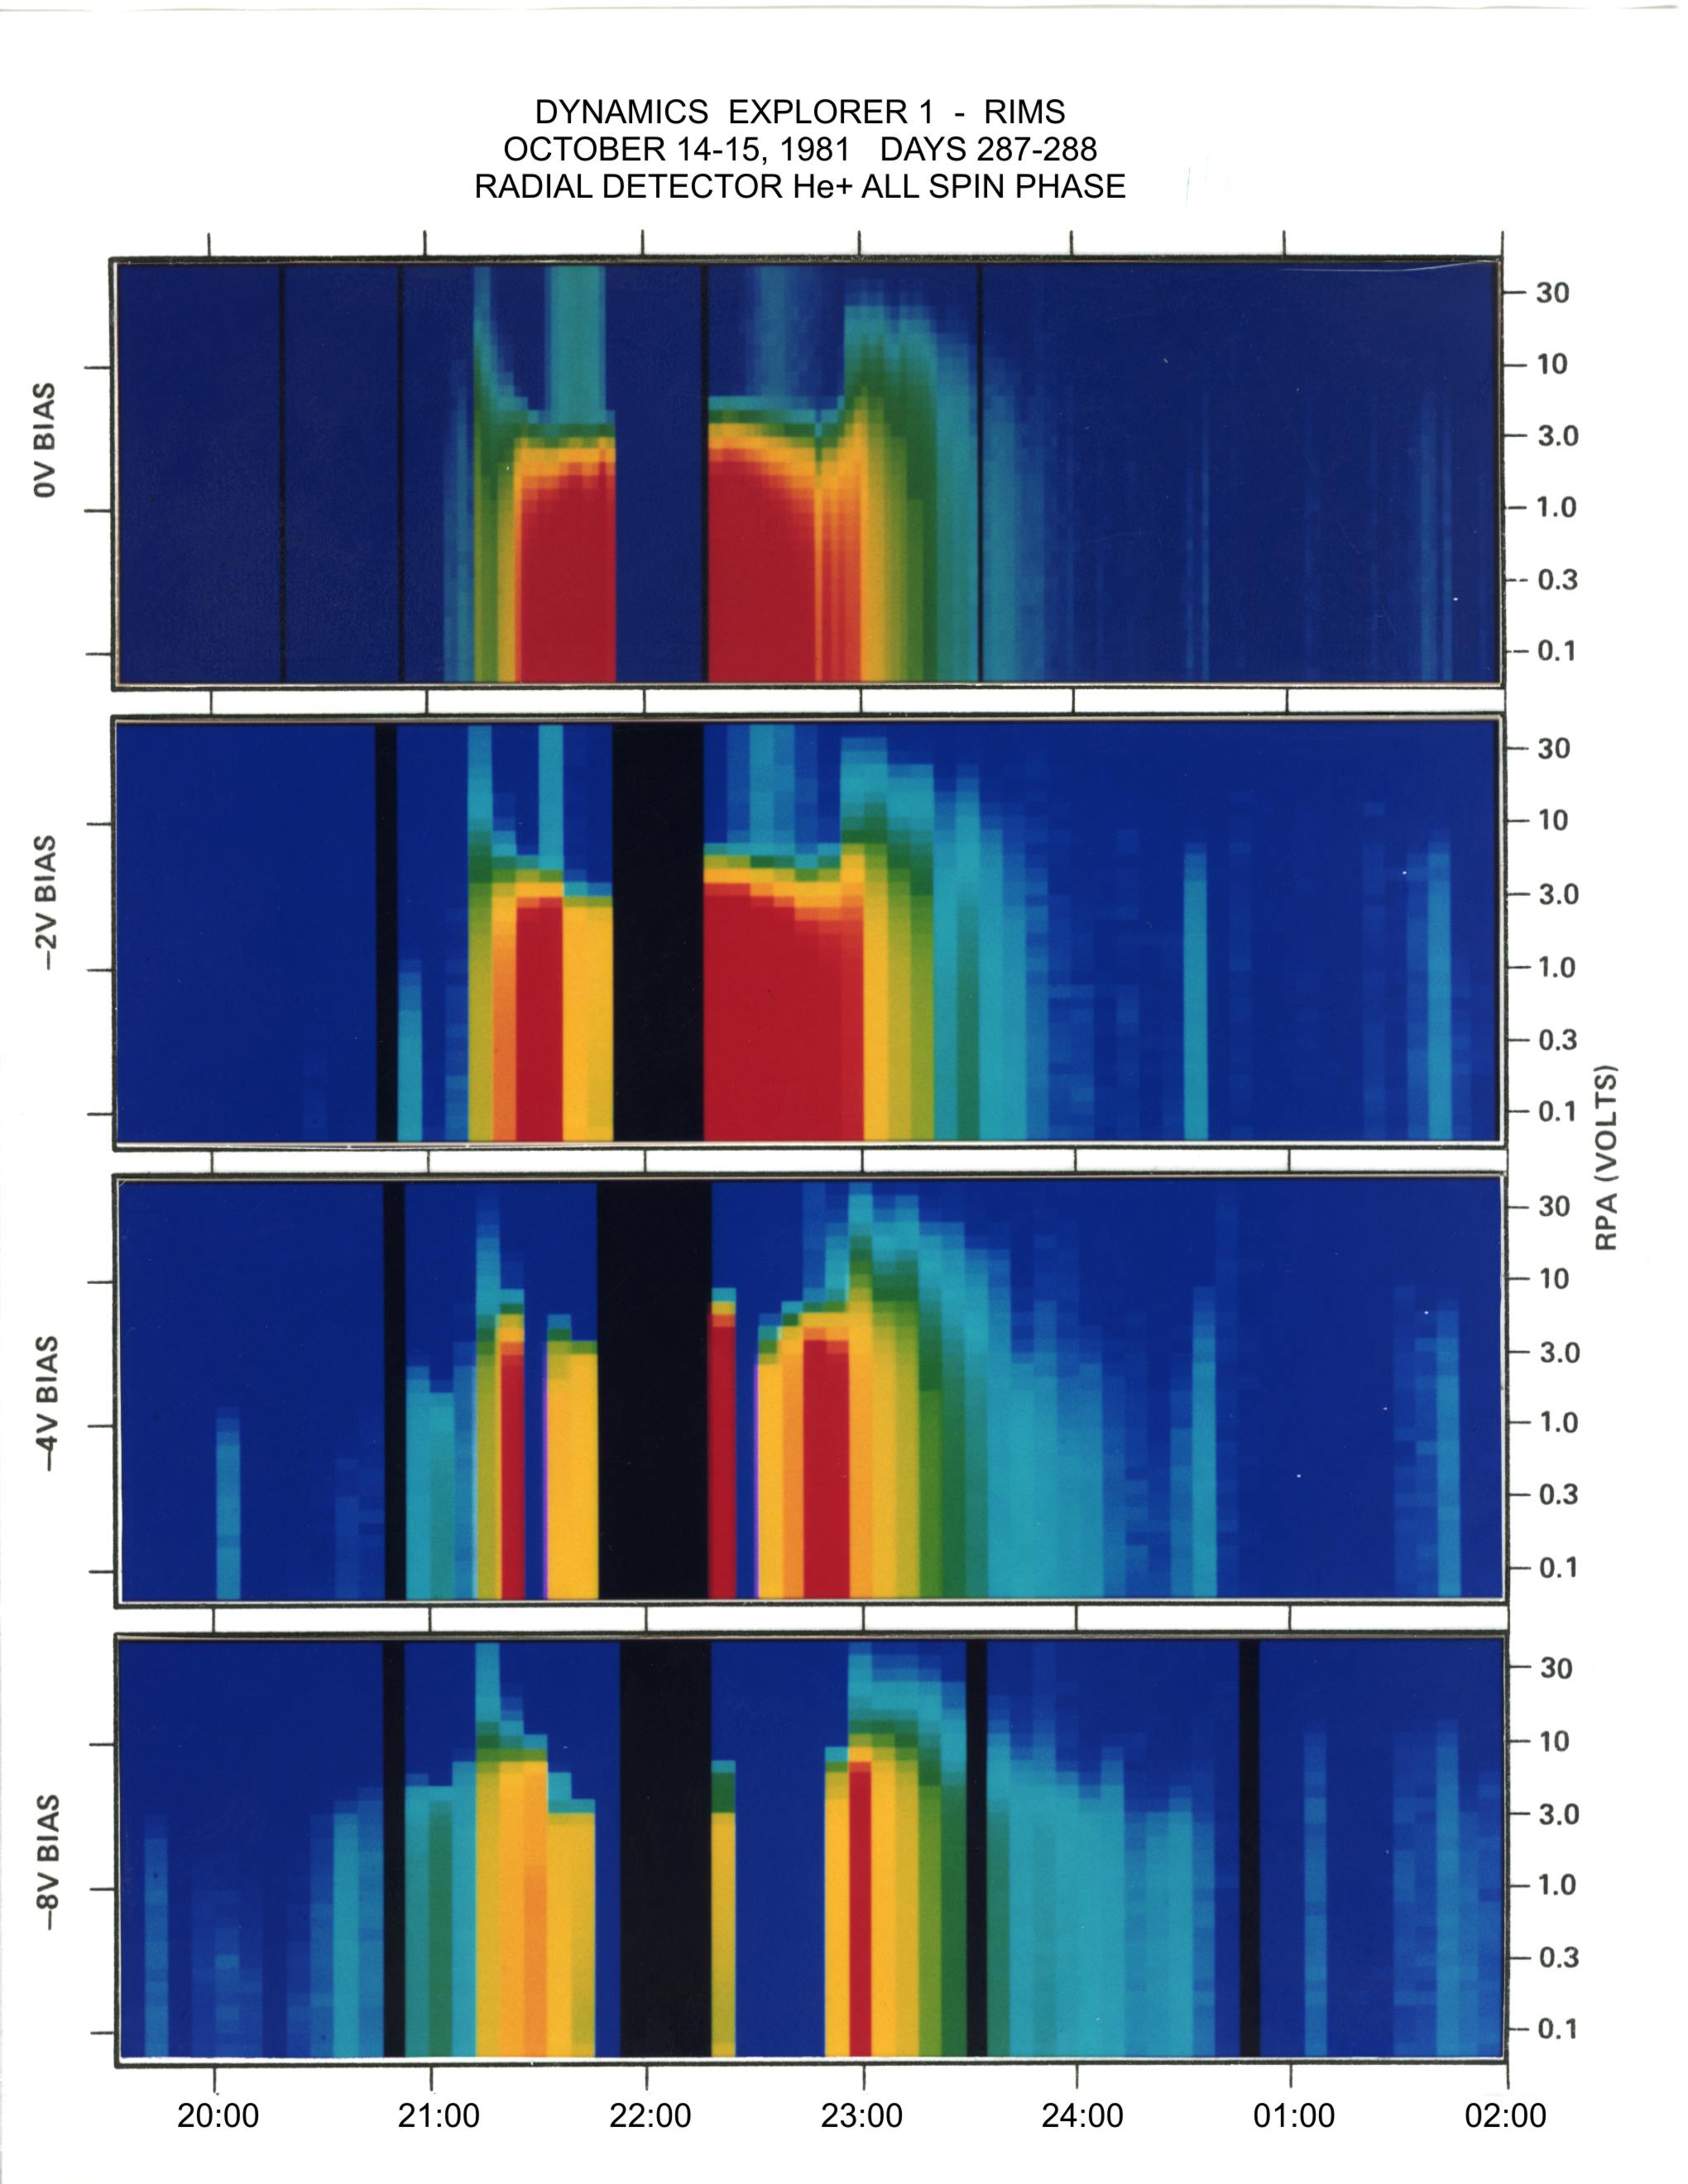 |
| RPA vs. time, Minus-Z detector | 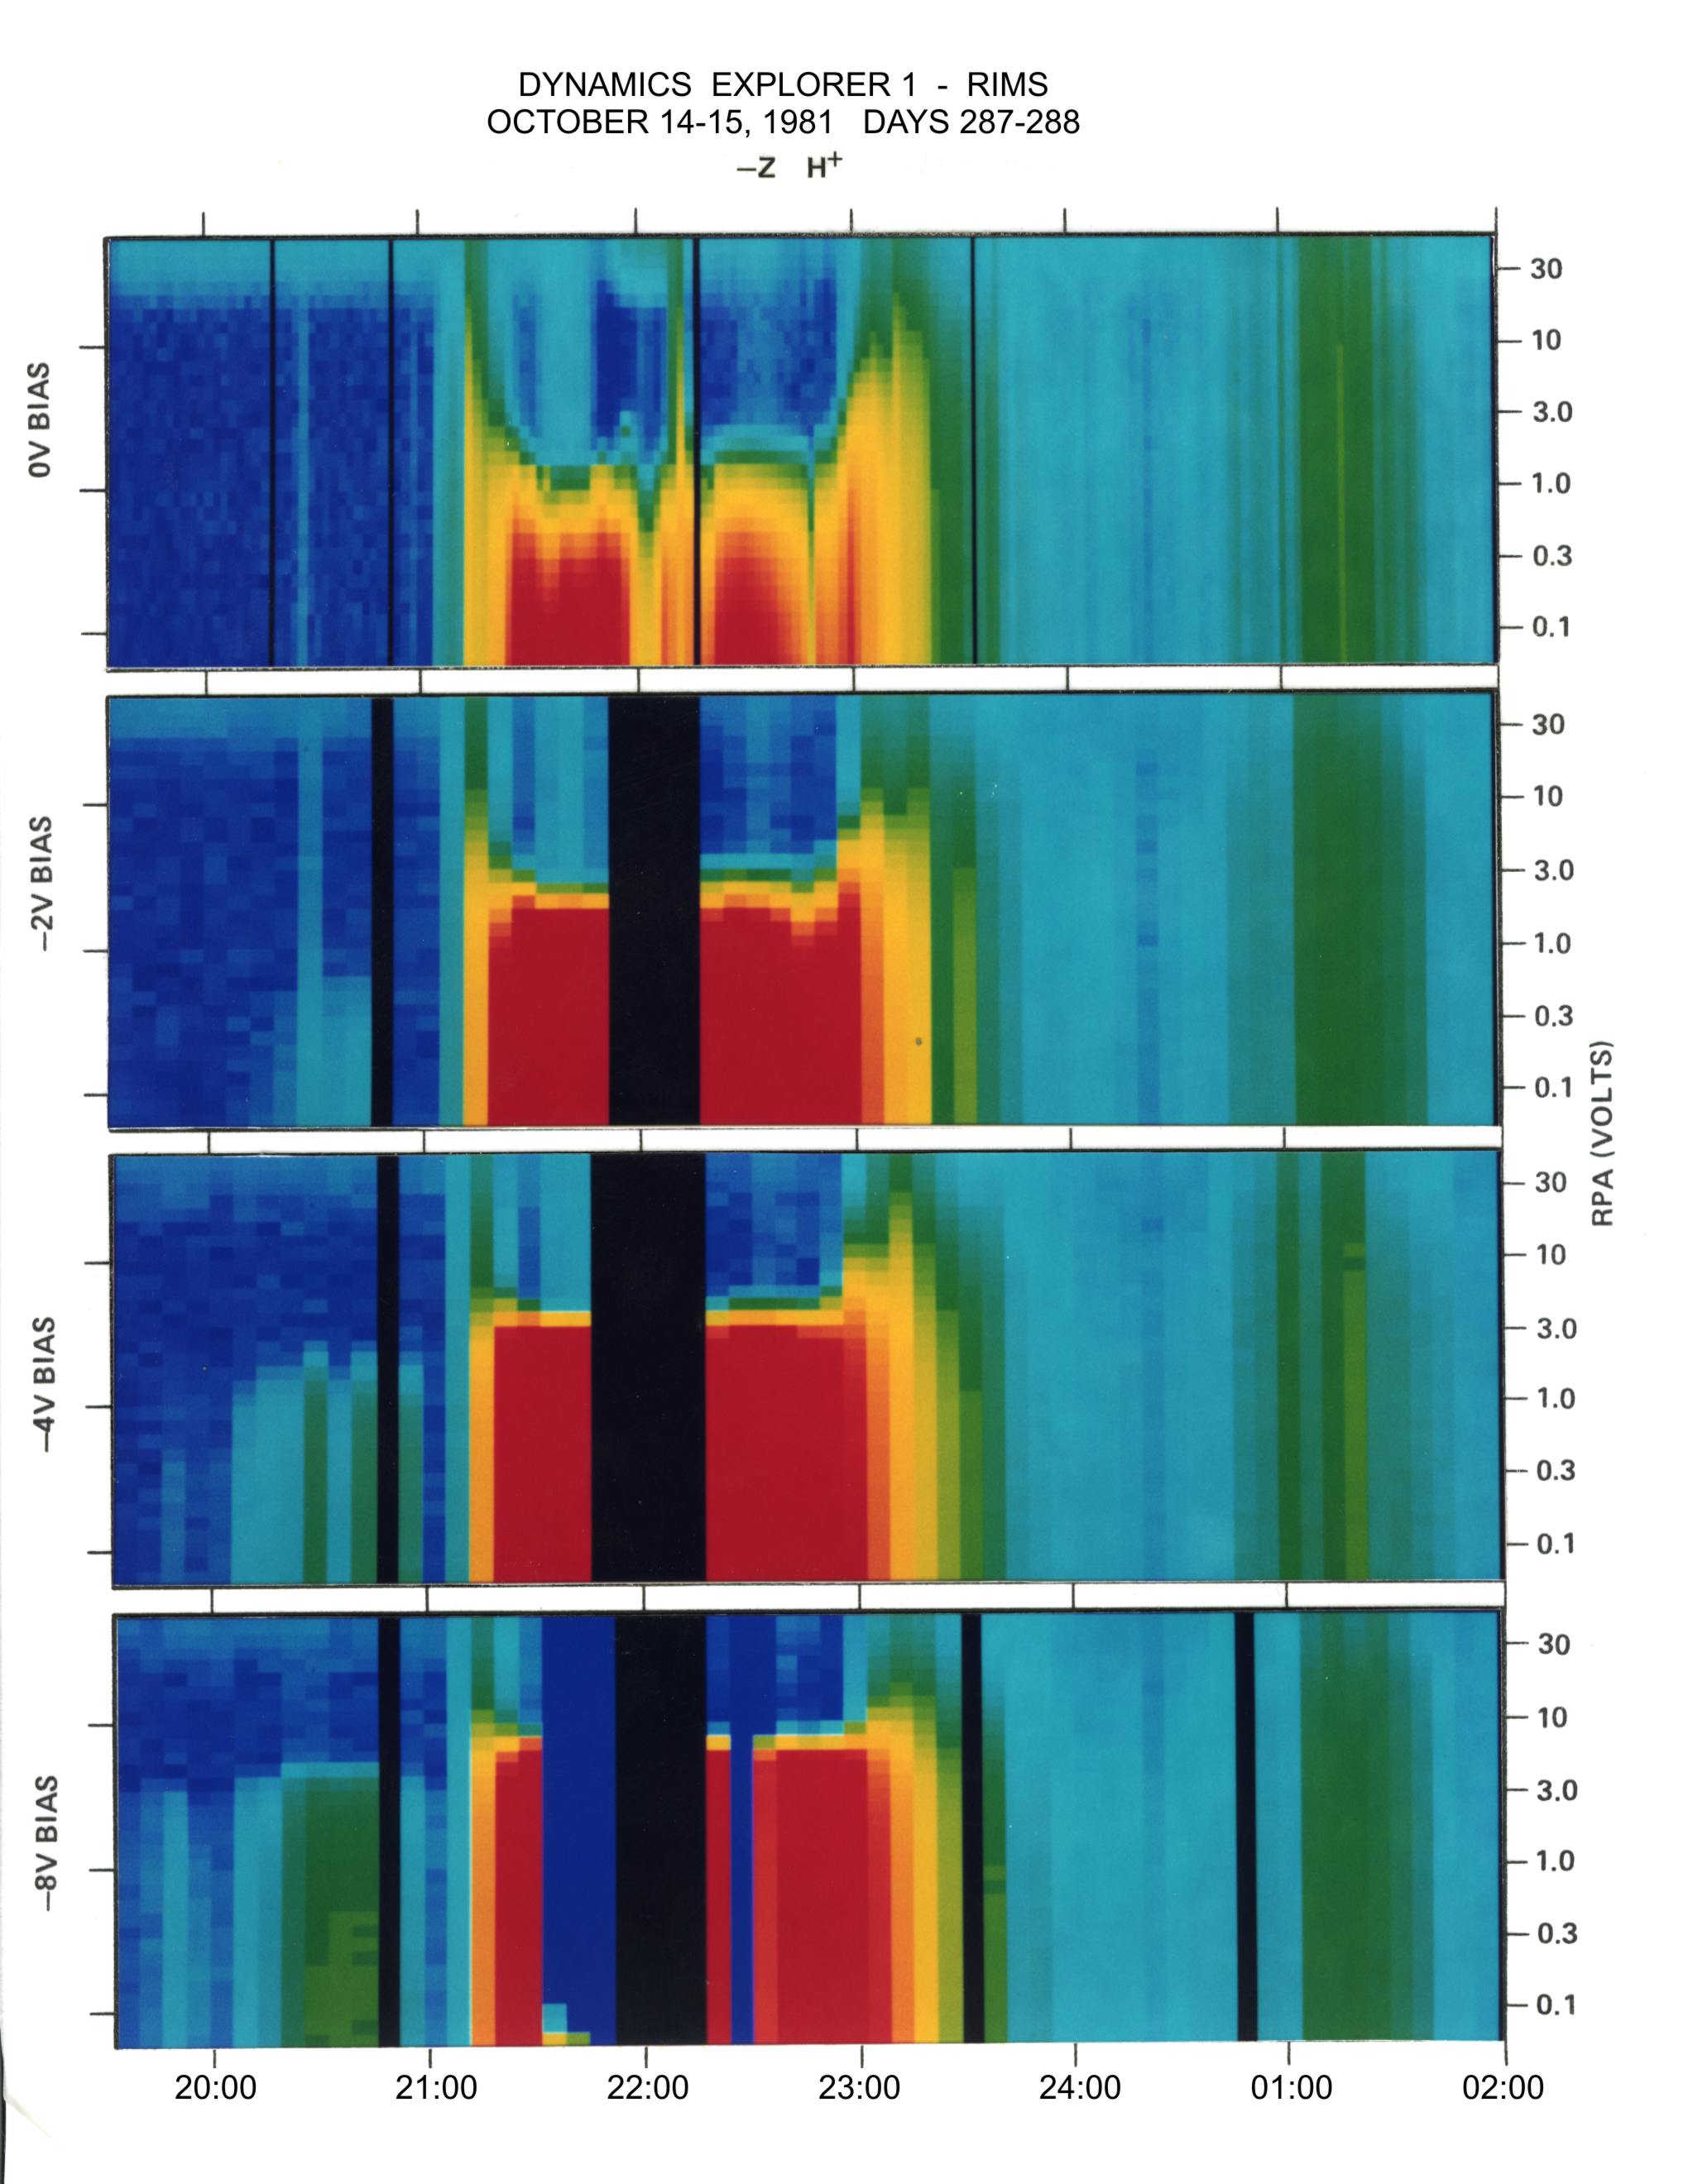 | 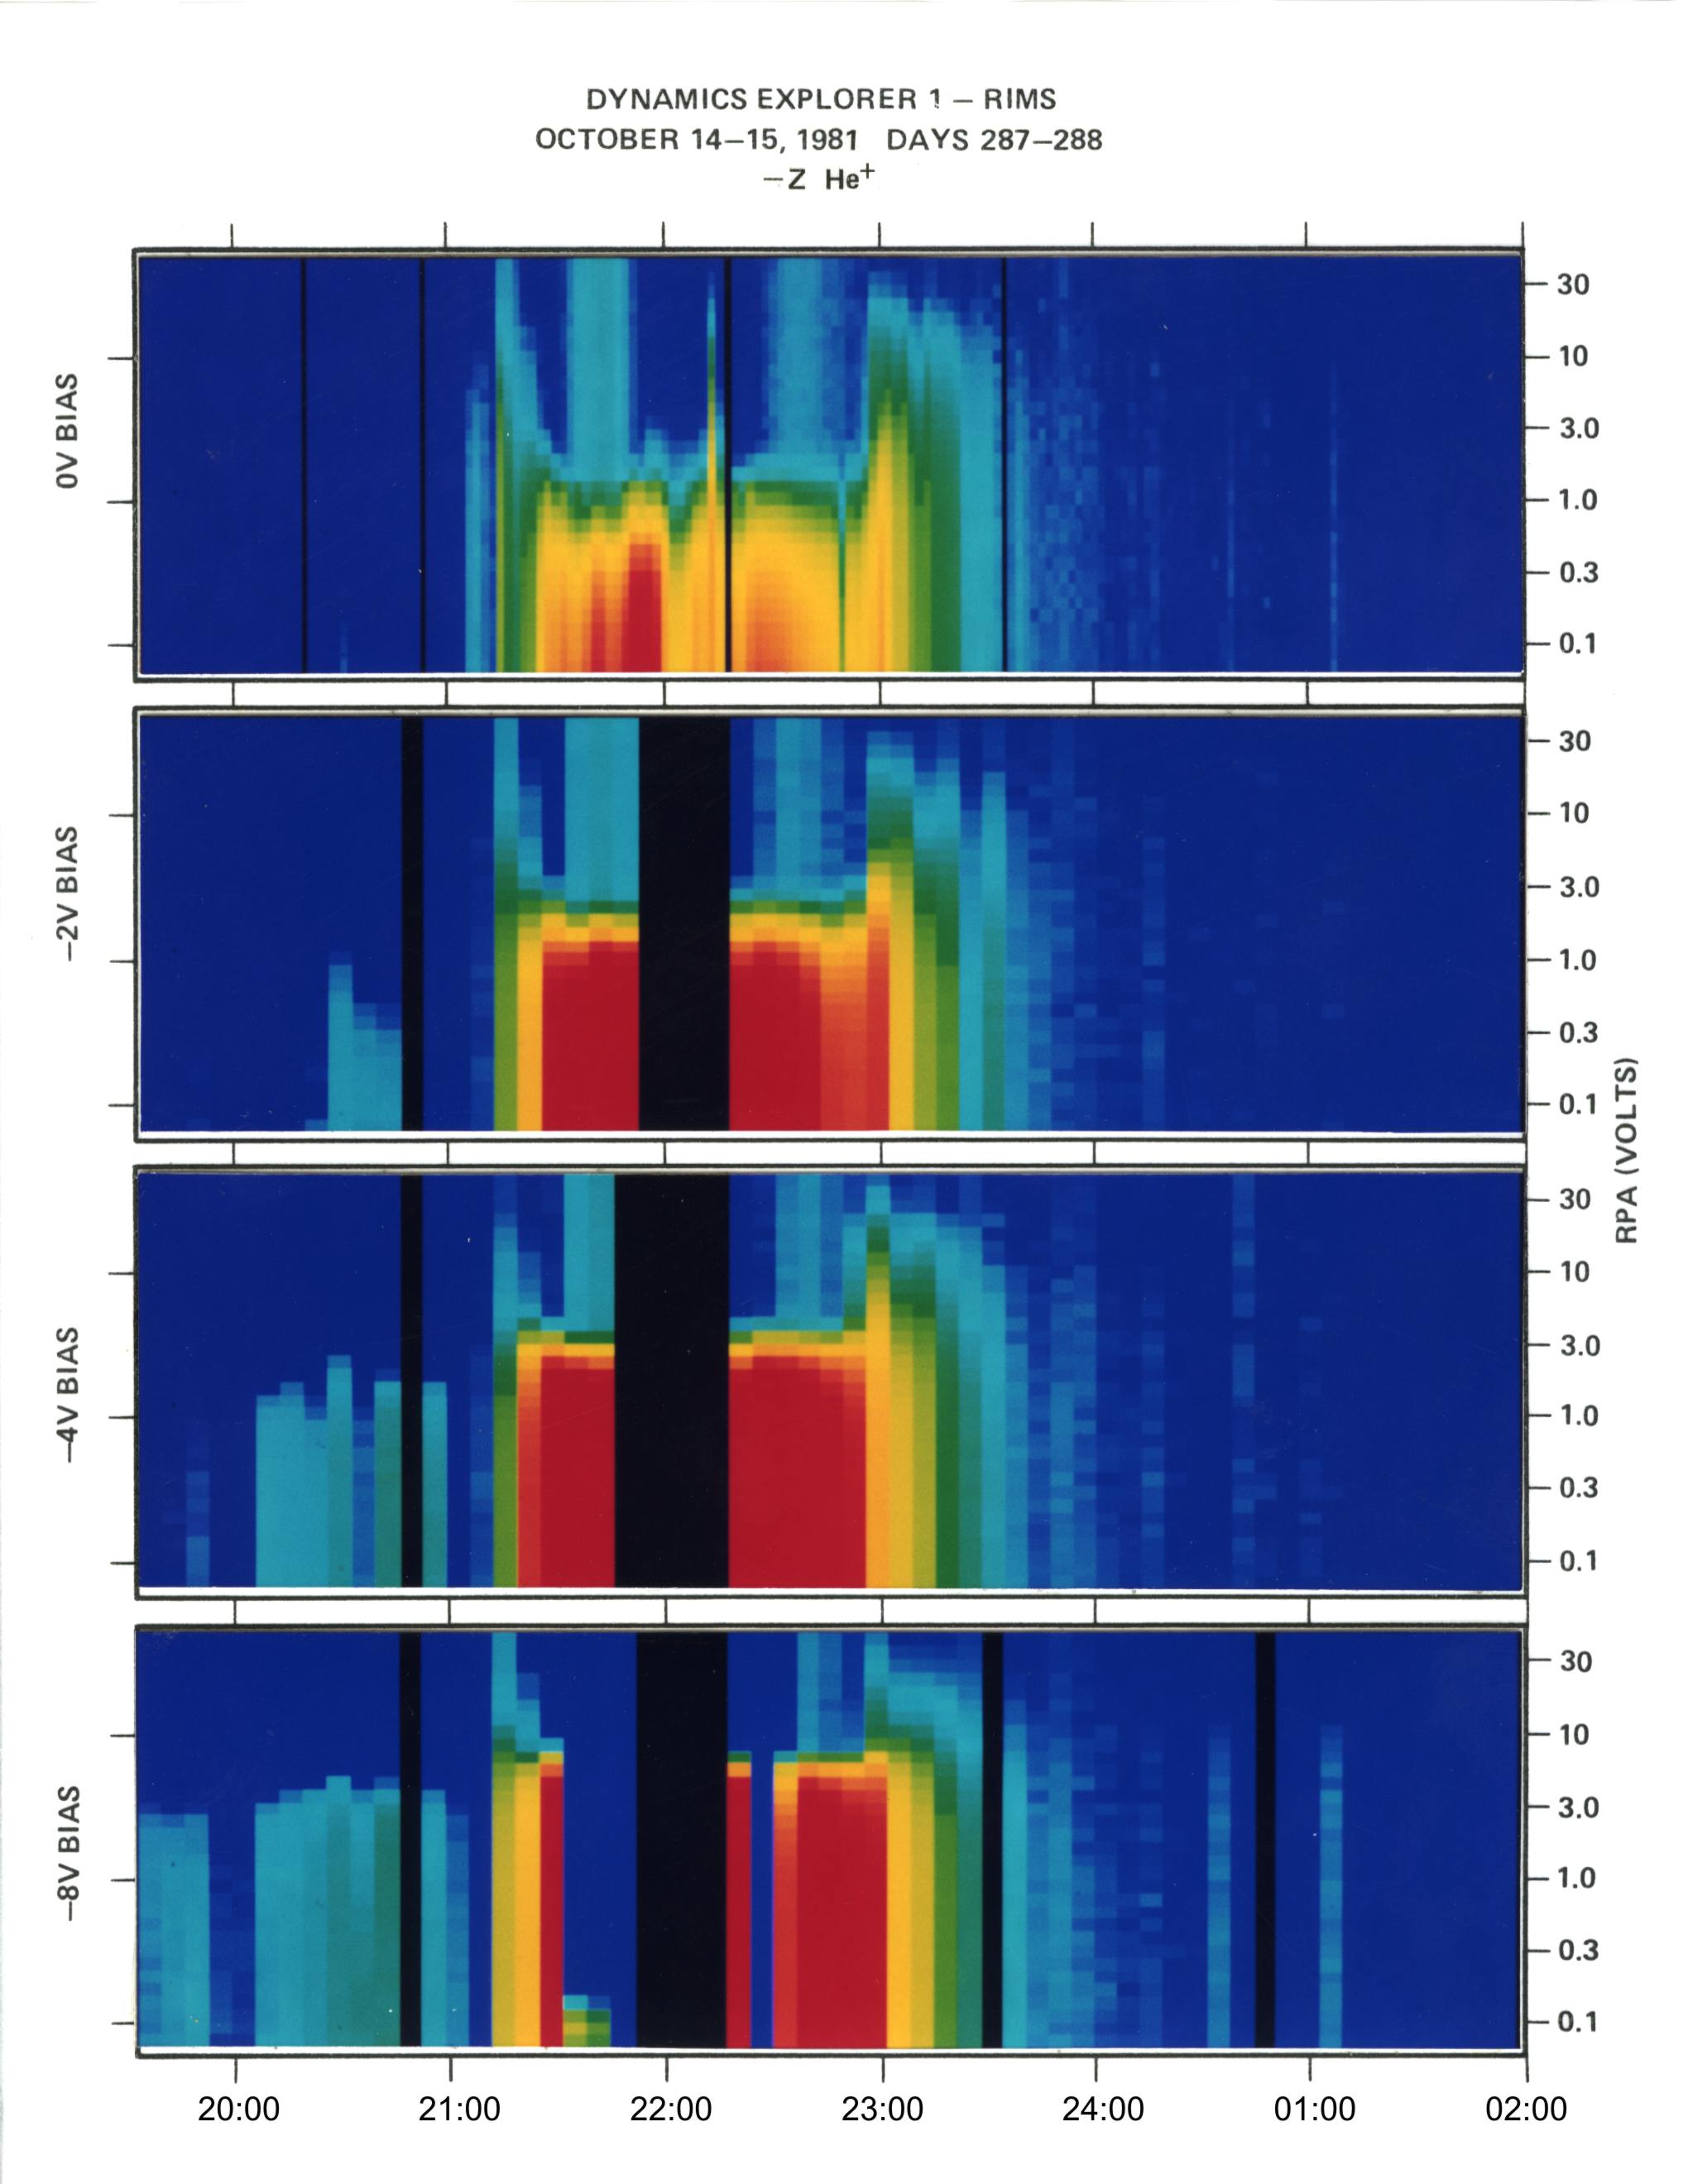 |
| RPA vs. time, Plus-Z detector | 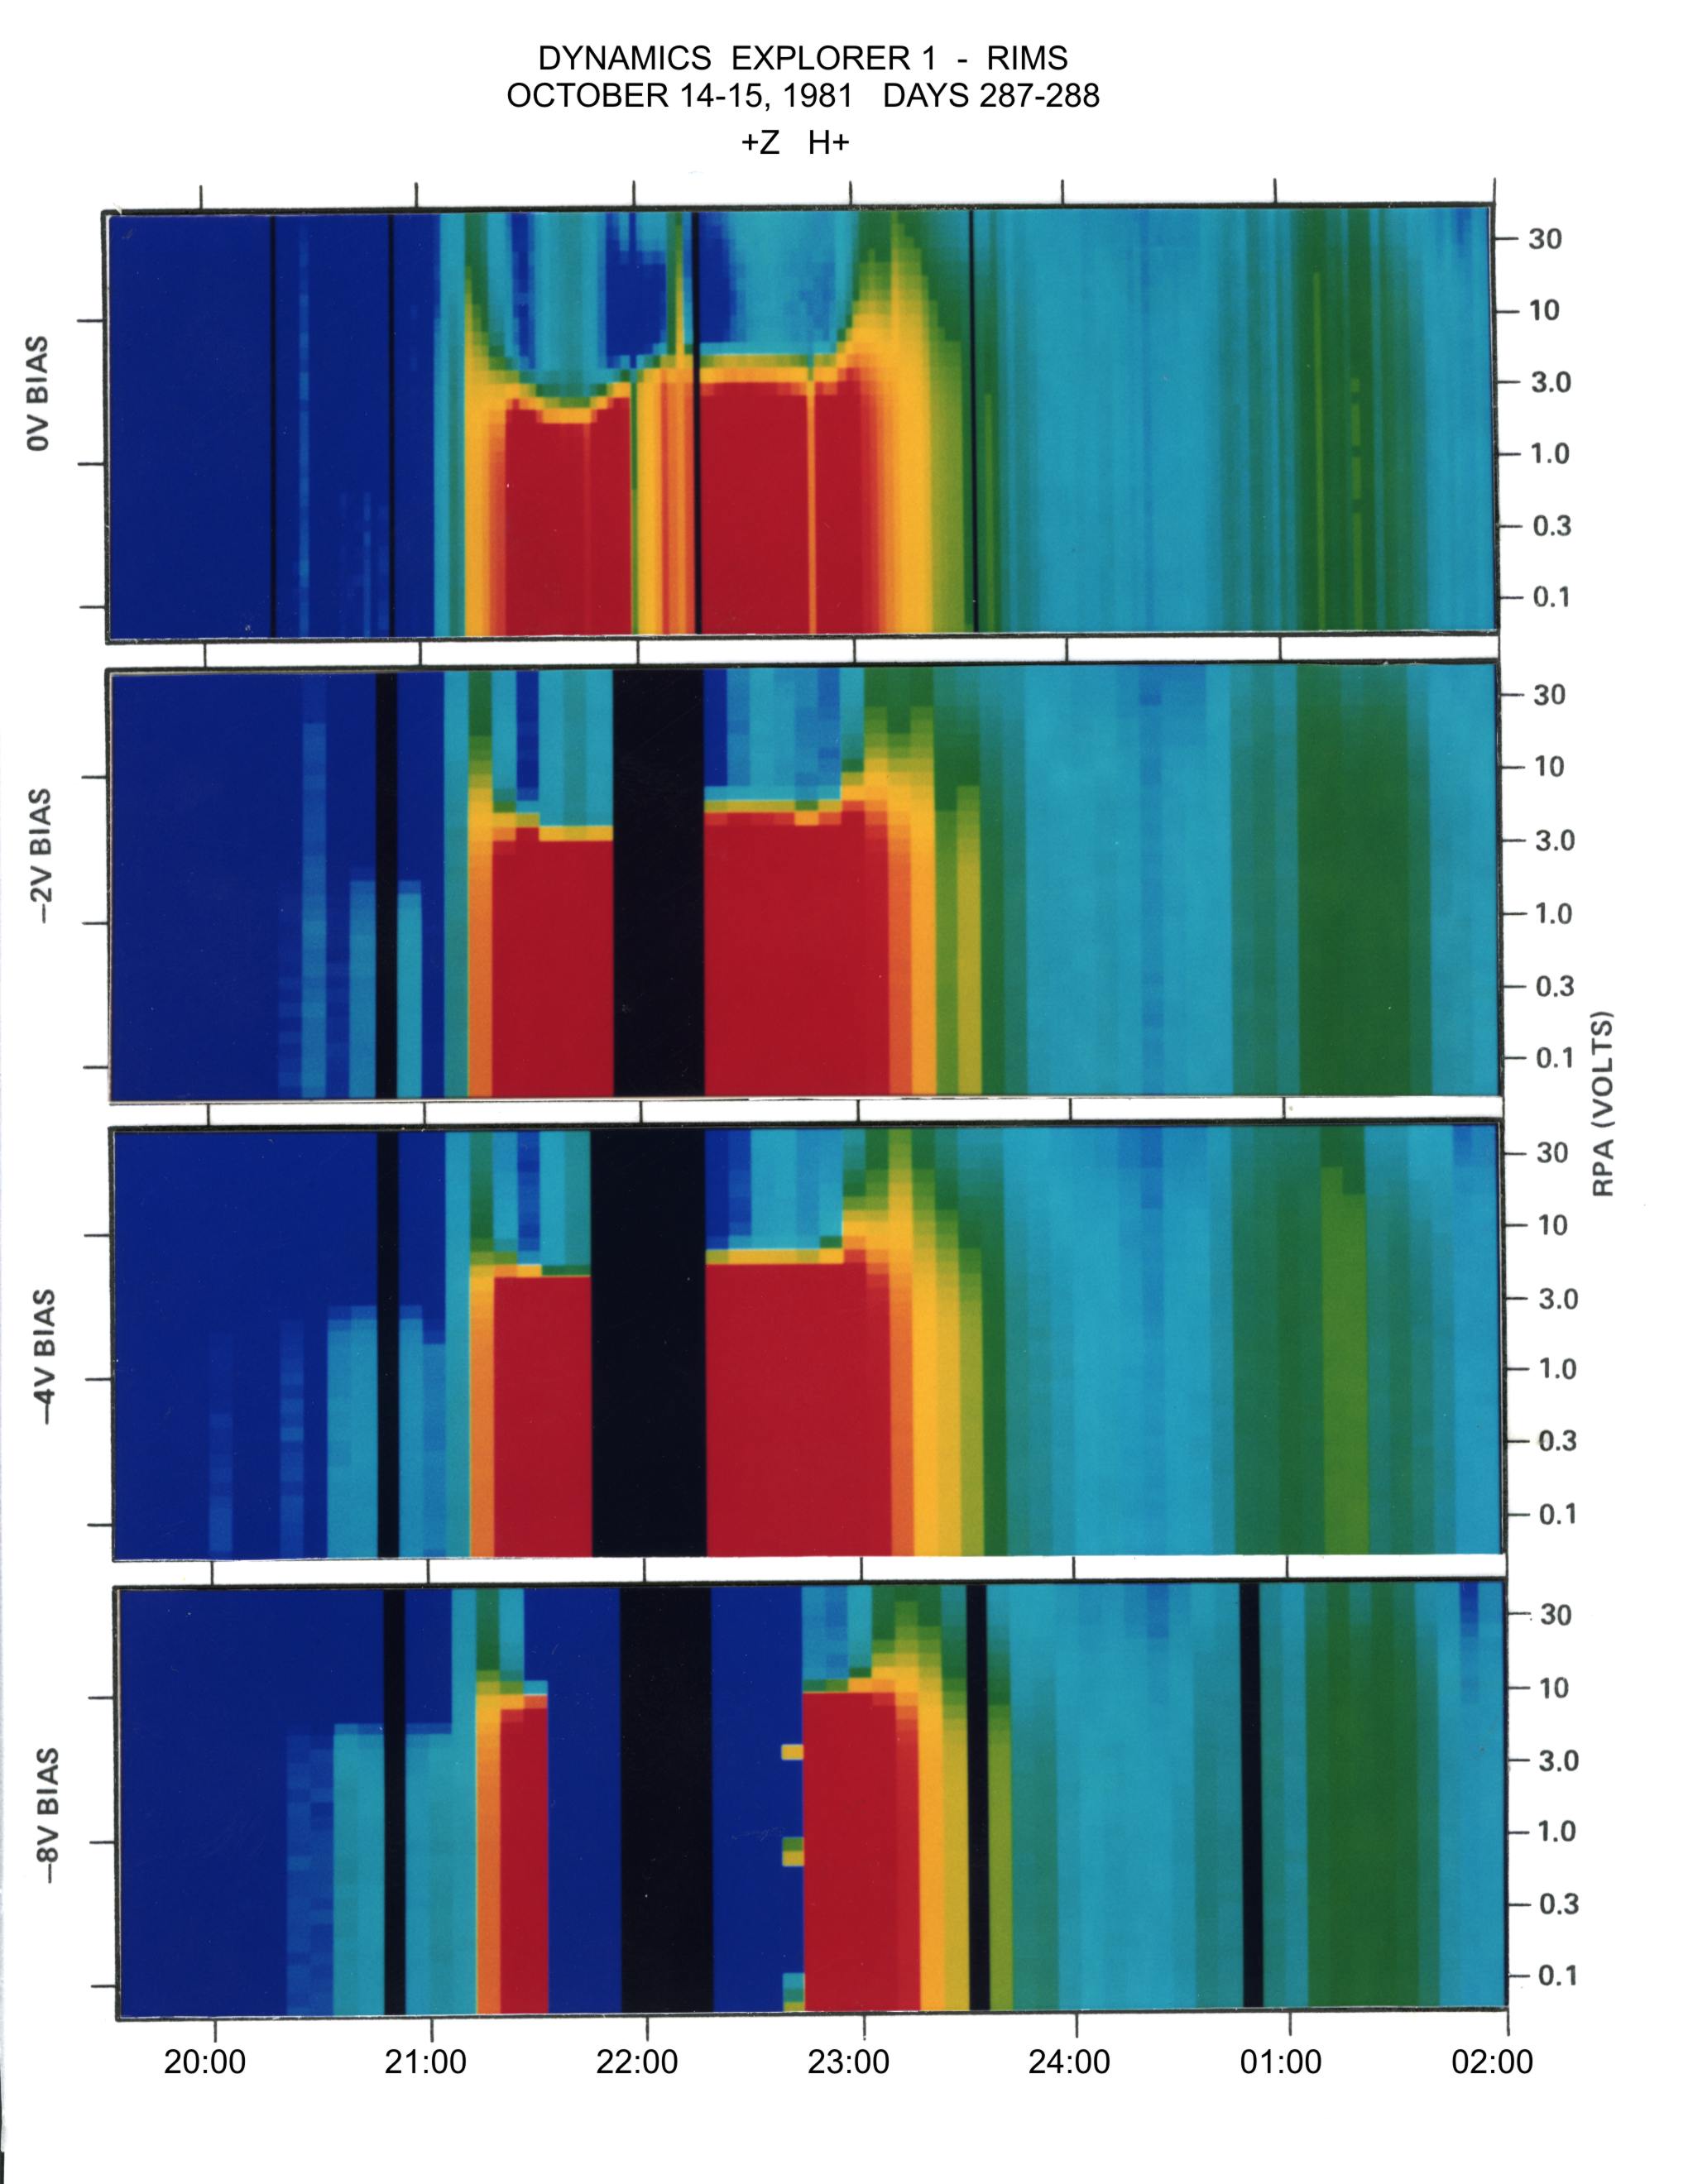 | 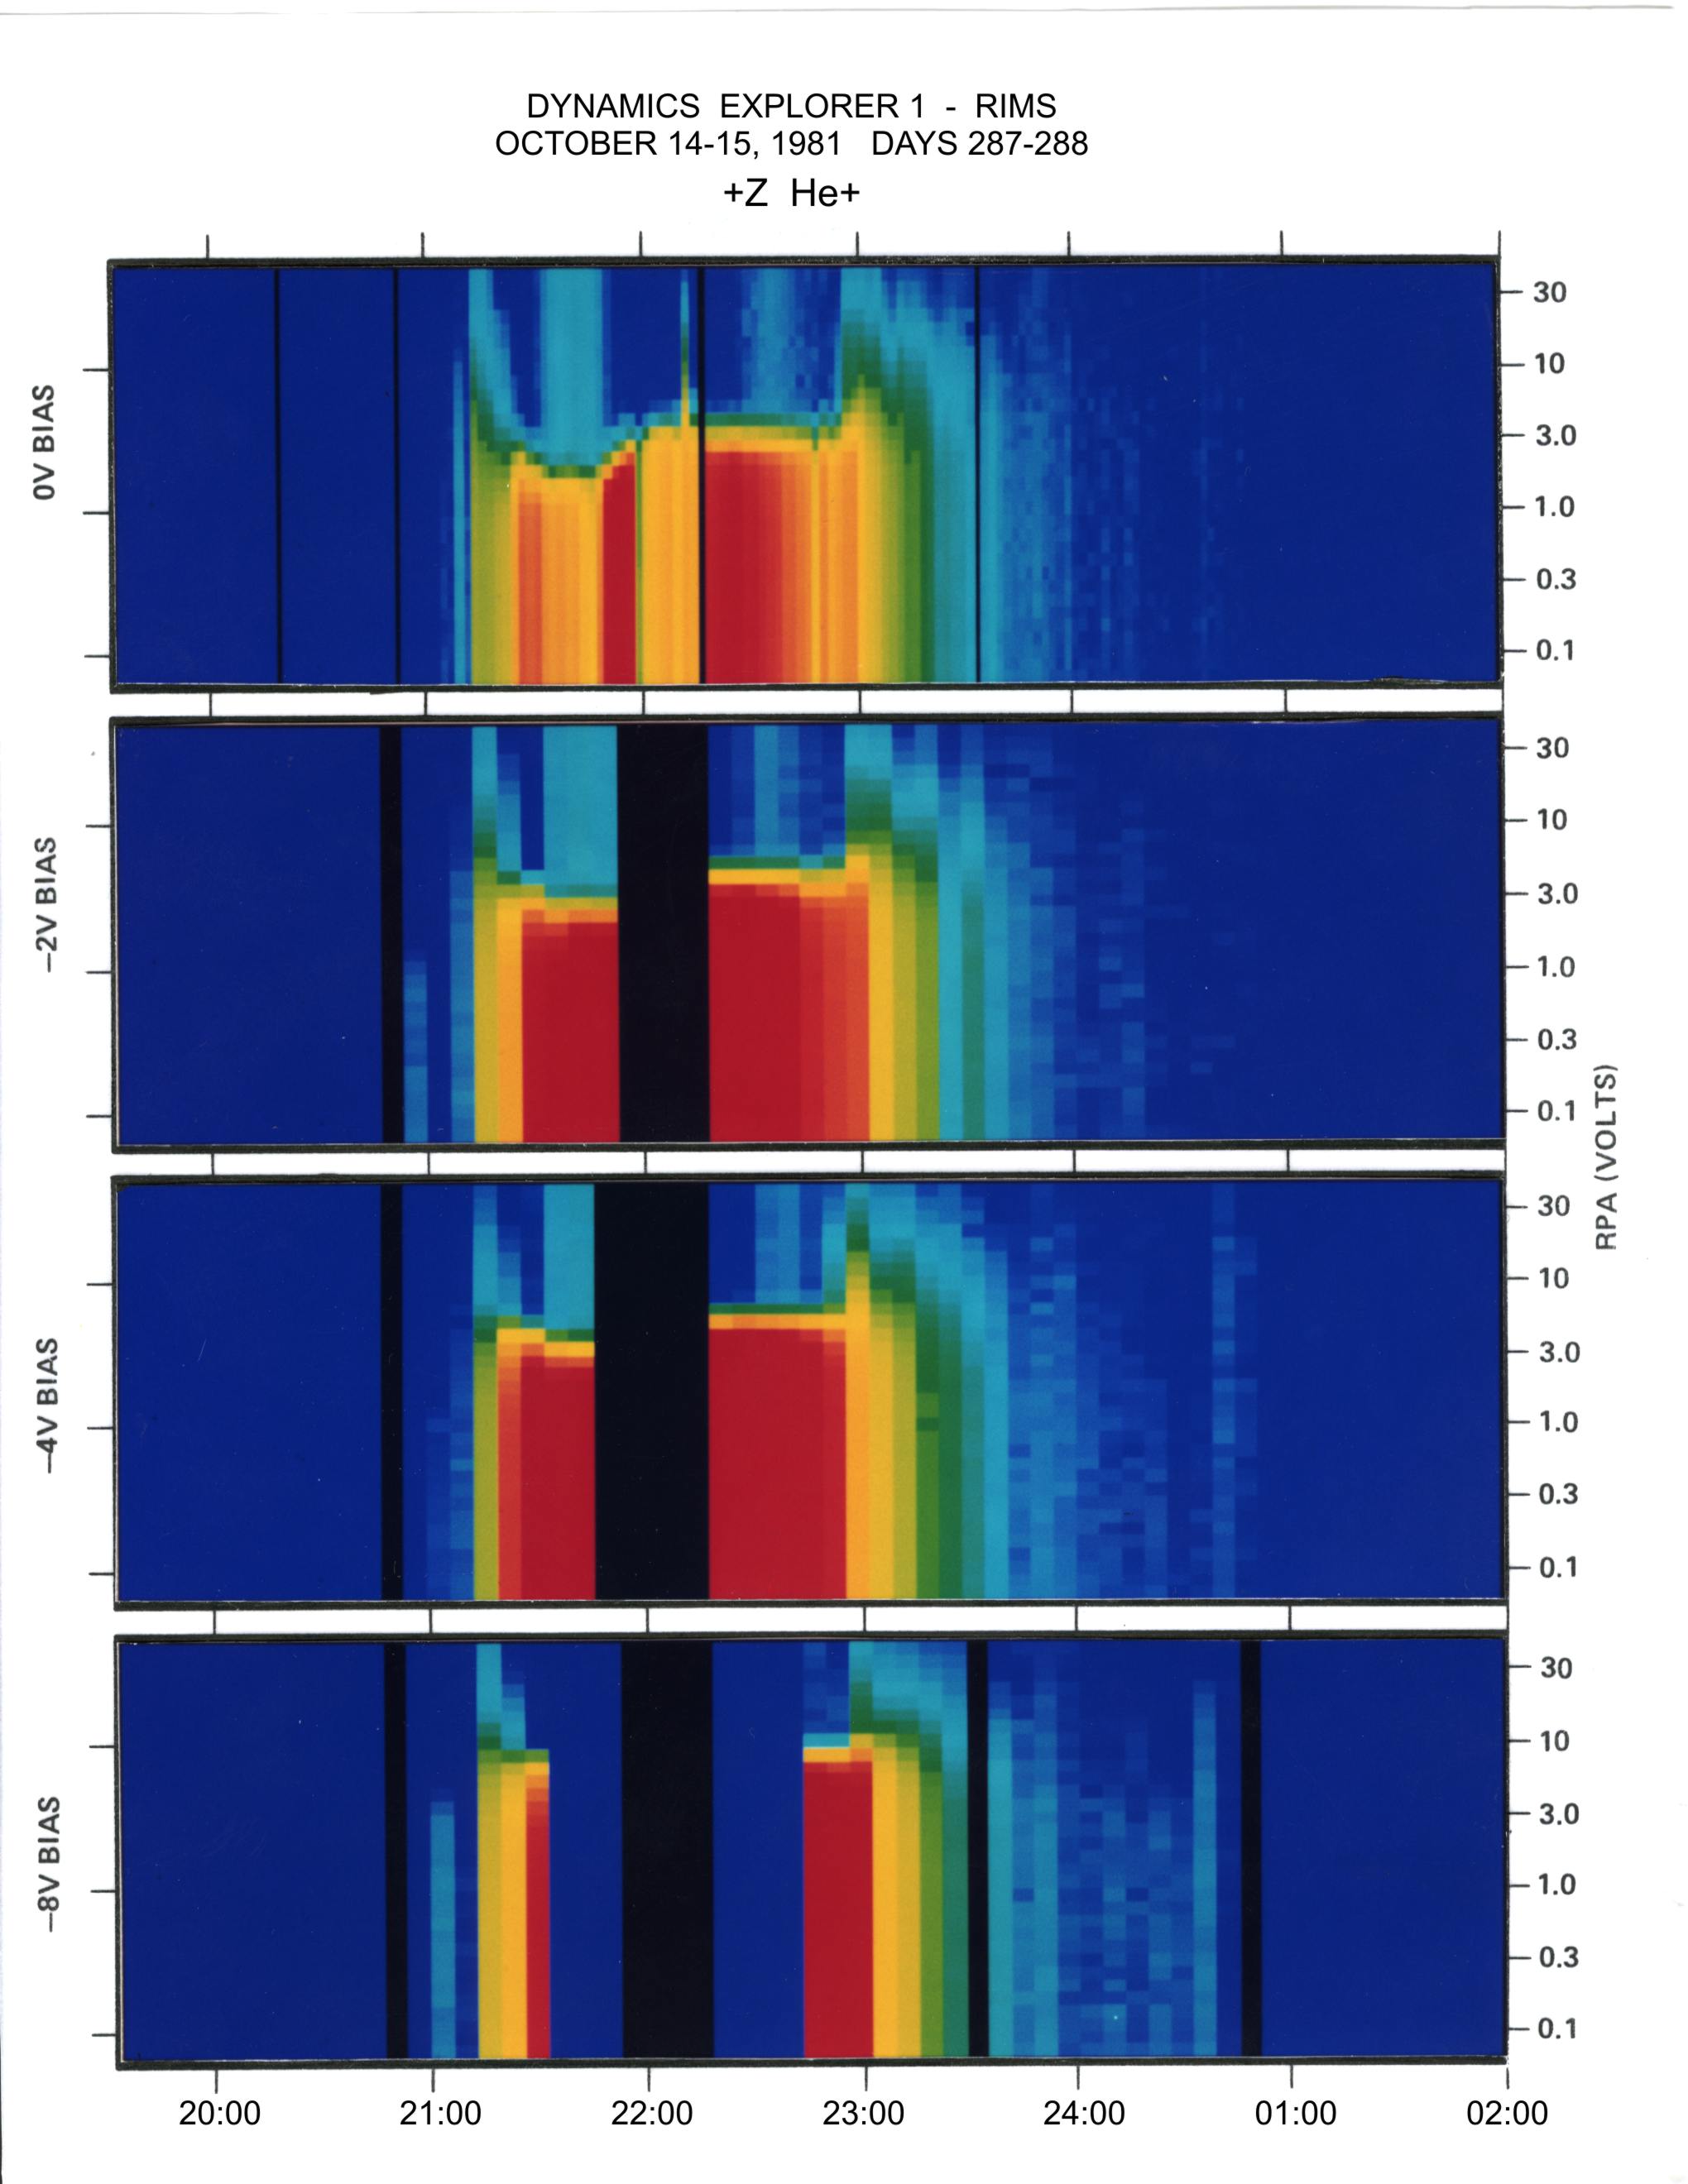 |